Why you shouldn’t ignore the dividend opportunities of global stocks
On June 16 this year, the quest for income became even more desperate. The Australian 10-year Government bond yield slumped below 2 per cent for the first time ever.
The record lows highlight just how difficult it is for an investor to find good income generating assets.
So it’s no surprise, and understandable, that most investors favour Australian equities given the benefits of fully franked dividends. Particularly, Australian retirees living off pension phase superannuation. Indeed, according to ATO SMSF Statistics June 2015 nearly one third of all self-managed super fund (SMSF) assets were in listed Australian shares.
But it’s important to know that this ‘home bias’ towards Australia is creating significant risks in your portfolio given the lack of diversification in local shares, but also the looming threat to local dividend payments. We are entering a period where it can’t be assumed that dividends from the major Aussie stocks will continue.
But it’s also important to know that the bias for Australian stocks means that investors could be missing out on big opportunities offshore. International equities can offer great portfolio diversification, but there are also dividend opportunities among global stocks that many Australian investors are ignoring. The sheer number of dividend paying stocks overseas means they may deliver much more regular dividends and payments than Australian stocks.
Therefore global equities may be considered as income assets as well.
Should this be the end of the ‘home bias’?
The past three years should have caused most investors to question their exposure to Australian shares. Australian shares (S&P/ASX200) returned only 5% pa (excluding franking) in the three years to April 2016, and recorded negative returns in the last of those years.
While franking credits have added an additional 1.6%pa over that time for Australian shares, 6.6%pa seems paltry when compared to the global returns. Over the same three-year period global shares earned 18.2%pa (MSCI World ex-Australian Net Returns in $A).
In accumulated returns, rather than compound returns, global shares have returned 65% over the past 3 years versus 21% for Australian shares after including the benefits of franking credits.
While it is known that past performance is no guarantee of future performance, the past three years have certainly made evident the benefits of global diversification, and the case for including some global equity exposure in a diversified Australian investment portfolio.
Chart 1. SMSF Asset Allocation June 2015
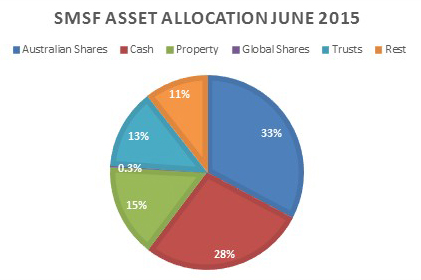
Source: Plato based on data from ATO SMSF Statistics June 2015.
Despite poor performance, most investors appear to continue to favour Australian equities. Australian shares continue to dominate SMSF portfolios, accounting for a third of investment.
Chart 1 provides a breakdown of SMSF asset allocation as at June 2015. Cash and term deposits were the next largest investment for SMSFs after Australian shares, making up approximately 28% of total net assets.
Residential and non-residential Australian property holdings accounted for 15% of net assets, while direct global share allocations were less than 1%.
SMSF exposure to global shares is likely to be somewhat higher than 1% due to indirect exposure to global shares in the 13% trust exposure, but nevertheless substantially lower than their weighting to Australian shares.
Of course the attraction of Australian shares for retirees is understood. Australian shares are currently yielding around 6% income for retirees. Once the value of franking credits are added, that’s substantially higher than the income available on other traditional asset classes like cash, fixed income and global shares.
Australian equities: consider the risks
Australian shares doesn’t come without risks to a portfolio.
Australian share prices have been severely challenged in the past year, and so too have dividends. For example, BHP had cut its interim dividend by 70% in February this year.
Anecdotal evidence suggests many SMSFs have significant holdings in BHP, the big four Australian banks and Telstra. Together these six stocks represent a very large part of the Australian equity market by value and by dividend income. Chart 2 shows the proportion of dividend income (including franking) made up by these 6 stocks.
Chart 2. Top dividend payers in the S&P/ASX200 in 2015.
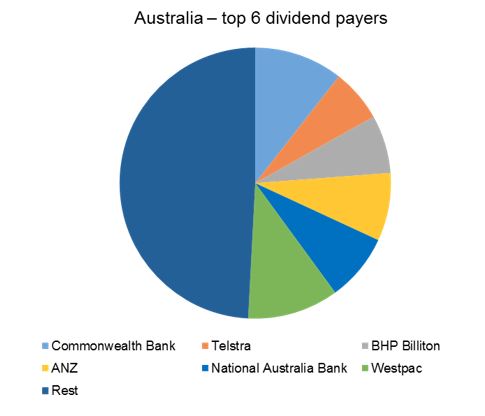
Source: Plato, Iress
This chart highlights how concentrated the Australian equity market is. Of the 200 stocks in the S&P/ASX200 index, the top 6 stocks represented over half the total dividend income in 2015.
BHP’s cut to its 2016 interim dividend indicates a timely warning that dividends are not guaranteed.
Companies can elect to cut or completely eliminate dividends altogether. With the four big banks representing approximately one third of that dividend income, if a banking industry incident were to occur, this could seriously impact the total dividends paid on the Australian share market, and in turn the income received by the average SMSF.
Diversifying with International equities
To maintain a dividend income stream whilst protecting a portfolio from the concentration and risks faced in Australia, investors may need to start considering offshore investments.
To provide a contrasting measure of how concentrated the Australian equity market is, we calculated the dividend composition for a global equity index. Chart 3 depicts the top 6 dividend paying stocks in the MSCI World ex Australia in 2015.
Chart 3. Top dividend payers in the MSCI World ex Australia in 2015.
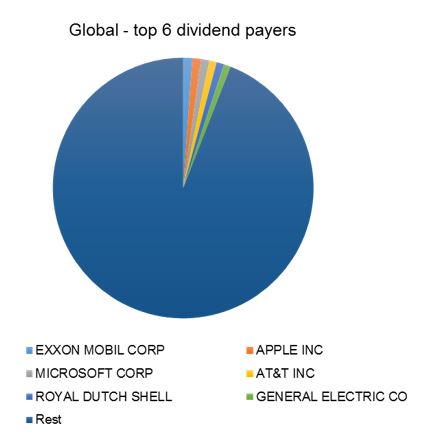
Source: Plato, MSCI.
As shown, the top 6 stocks represent less than 10% of the total dividends of the global index in 2015, and the make-up of those top 6 stocks is far different. The top 6 reflect globally recognisable brand names in energy, electronics, software, telecommunications and an industrial conglomerate.
It is evident that the income derived from the global index is likely to be more diversified, and therefore not dominated by a single industry in a single geographic location, like the Australian banking is to the Australian index.
An opportunity set offshore
Global equities in the past may not have been considered as high yielding assets, but the income opportunities among global stocks are promising when compared to those offered in the Australian market.
In Chart 4 we display the average number of stocks going ex-dividend each month for the Australian S&P/ASX300 index and a World Developed markets (only) universe of comparable sized stocks over the period 2000-2014.
In Australia there are some months when virtually no companies or trusts go ex-dividend, like January, whereas globally a minimum of 400 stocks go ex-dividend. At the other end of the scale, in March, approximately 80 stocks go ex-dividend in Australia versus almost 2000 globally.
Why does that matter? The bigger number of stocks going ex-dividend means the more likely that regular distributions will be received, implying more regular income streams.
Chart 4. Australian and global developed world dividend opportunity set
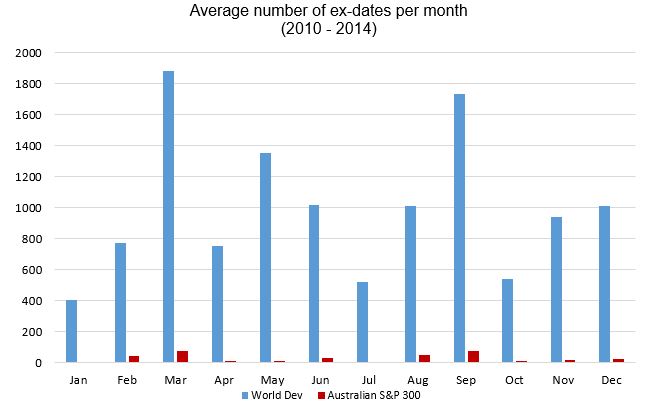
Source: Plato, Factset, Iress
Summary
As mentioned, we understand why retirees may, prefer local Australian stocks as an income stream from franking credits.
But a close inspection of the S&P/ASX200 reveals that the Australian share market is quite heavily concentrated in a few very large cap stocks. The Australian equity market is poorly diversified, with 6 stocks representing more than half of the dividends paid out in 2015, of which 4 were Australian banks.
The Australian market is particularly poorly diversified when compared to developed global share markets.
Therefore opportunities may exist by exploring the dividend opportunities among global stocks, with hundreds or thousands going ex-dividend each month. If managed for income generation, the greater opportunity from global equities dividends may provide potential for generating diversified income from portfolios.
About Plato Investment Management
Plato Investment Management Limited is a retirement income equities specialist with a dedicated portfolio of funds specifically designed to meet the income needs of retirees in pension phase superannuation.
The two global income funds managed by Plato are the Plato Global Shares Income Fund (PLI03), an unhedged global equity income fund and the Plato Global Shares Income Fund ( Managed Risk) (PLI04) which aims to stabilise portfolio volatility, capture growth in up markets, and defend against losses during major downturns. These funds complement the existing domestic equity income funds managed by Plato, the Plato Australian Shares Income Fund (PLI01) and the Plato Australian Shares Income Fund (Managed Risk) (PLI02).
Visit the Fund Information page for more detail.
This communication has been prepared by Plato Investment Management Limited (Plato) ABN 77120730136 Authorised Representative No. 304964 of Pinnacle Investment Management Limited ABN 66109659109 AFSL 322140. This communication is for general information only and has been prepared without taking account of any person's objectives, financial situation or needs. Any persons relying on this information should obtain professional advice relevant to their particular circumstances, needs and investment objectives. Past performance is not a reliable indicator of future performance. The information is not intended as a securities recommendation or statement of opinion intended to influence a person or persons in making a decision in relation to investment. Plato believes the information provided is reliable, however, it does not warrant that it is accurate and persons relying on the information do so at their own risk. To the extent permitted by law, Plato disclaims all liability to any person relying on the information in respect of any loss or damage (including consequential loss or damage) however caused, which may be suffered or arise directly or indirectly in respect of such information. Any opinions or forecasts reflect the judgment and assumptions of Plato and its representatives on the basis of information at the date of publication and may later change without notice. Interests in the Plato Global Shares Income Fund (ARSN 608 130 838) are issued by Pinnacle Fund Services Limited, ABN 29 082 494 362, AFSL 238371, the Responsible Entity of the Fund. The Responsible Entity is not licensed to provide financial product advice. A copy of the most recent Product Disclosure Statement (‘PDS’) of the Fund can be located at www.plato.com.au/retail-funds/. You should consider the relevant PDS in its entirety before making an investment decision.