
5 charts to help you through COVID-19 investment fear
- Fri 03 April 2020
History may not repeat but it has common themes for long-term share investors.
The coronavirus crisis is first and foremost a human crisis and my thoughts are particularly with those on the front line of the battle. But, of course, it is affecting many aspects of life, including investment markets.
Successful investing can be really difficult in times when markets have collapsed into a bear phase with large falls globally from their highs amid immense uncertainty about the economic hit from coronavirus and how much policy stimulus and central bank support can head off collateral damage and boost an eventual recovery.
Trying to work this out is driving huge volatility in investment markets, making it very easy for short-term traders to get whipsawed.
I am the first to admit my crystal ball is even hazier than normal right now. As the US economist JK Galbraith once said: “There are two types of economists – those that don’t know and those that don’t know they don’t know.” This is certainly an environment where much is unknown.
But while history does not repeat in that each cycle is different, it does rhyme in that each has many common characteristics. While we have not seen a pandemic-driven bear market before, the basic principles of investing have not changed.
This article revisits five charts I find particularly useful in times of stress.
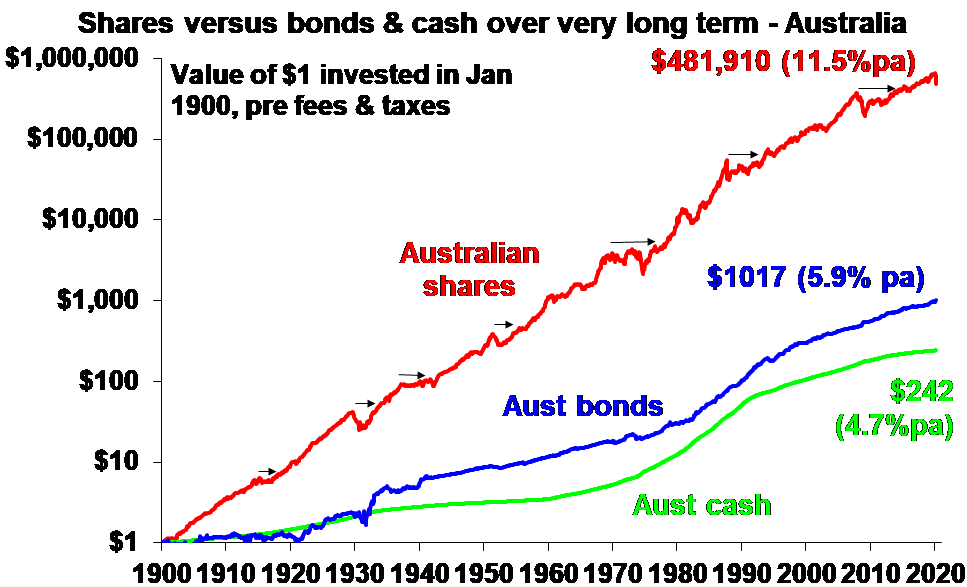
Chart 1: The power of compound interest
This is my favourite chart. It shows the value of $1 invested in various Australian assets in 1900, allowing for the reinvestment of dividends and interest along the way. That $1 would have grown to $242 if invested in cash, $1017 if invested in bonds and $481,910 if invested in shares.
Although the average return since 1900 is only double that in shares relative to bonds, the huge difference between the two at the end is the effect of compounding, or earning returns on top of returns.
Any interest or return earned in one period is added to the original investment so that it all earns a return in the next period, and so on. I only have Australian residential property data back to 1926, but out of interest it shows (on average) similar long-term compounded returns to shares.
Source: Bloomberg, AMP Capital
Key message: To grow wealth we must have exposure to growth assets such as shares and property. Although shares have collapsed lately and the short-term outlook for Australian housing is also vulnerable, both are likely to do well over the long-term.
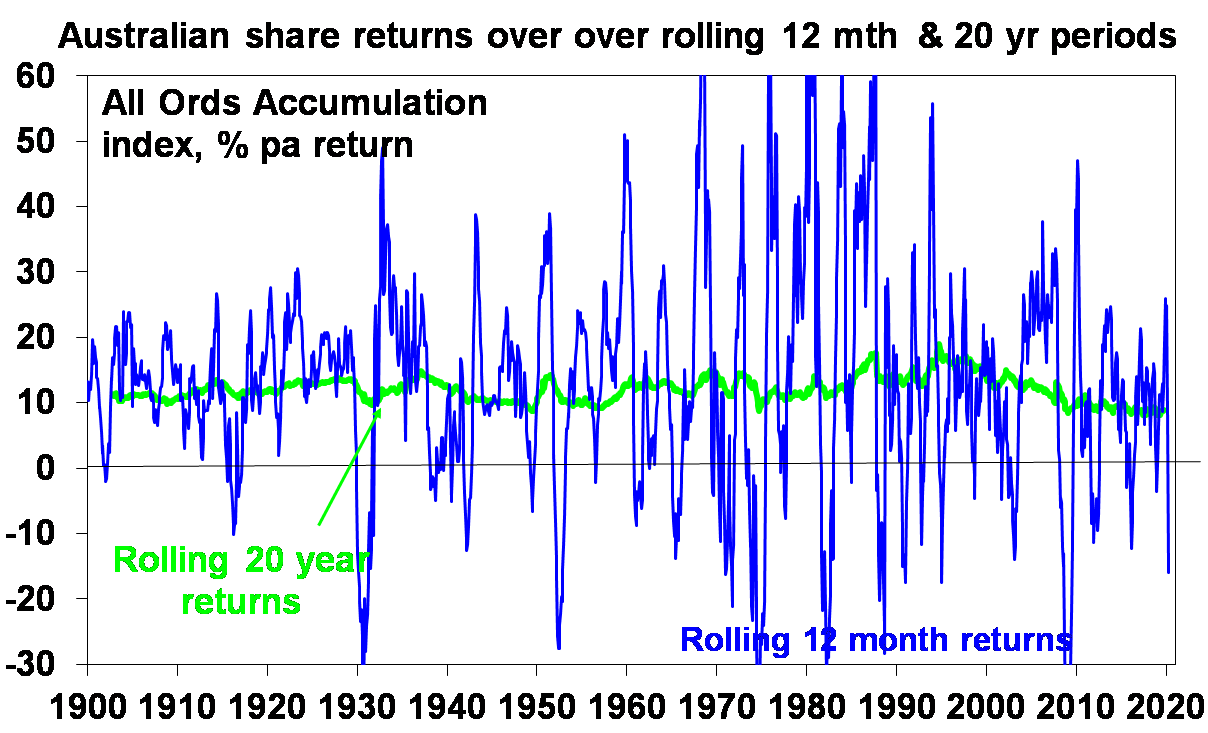
Chart 2: Don’t get blown off by cyclical swings
The trouble is that shares can have lots of setbacks along the way, as is evident during periods highlighted by the arrows on the previous chart. Just like now. Even annual returns in the sharemarket are highly volatile, but longer-term returns tend to be solid and relatively smooth, as can be seen in the next chart.
Since 1900, Australian shares for roughly two years out of 10 have had negative returns but no negative returns over rolling 20-year periods.
Source: Bloomberg, AMP Capital
The higher returns shares produce over time relative to cash and bonds is compensation for the periodic setbacks. But understanding that these periodic setbacks are just an inevitable part of investing is important in being able to stay the course and get the benefit of the higher long-term returns that shares and other growth assets provide over time.
Key message: Short-term and sometimes violent swings in sharemarkets are a fact of life, but the longer the time horizon the greater the chance your investments will meet their goals. In investing, time is on your side and it is best to invest for the long-term when you can.
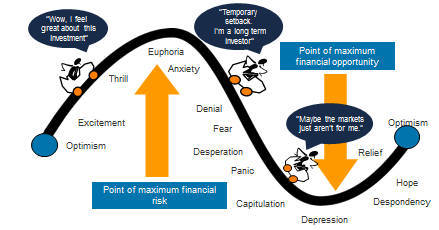
Chart 3: The rollercoaster of investor emotion
It is well known that the swings in investment markets are more than can be justified by moves in investment fundamentals alone – profits, dividends, rents and interest rates. This is because investor emotion plays a huge part, which has been more than evident over the past two months.
The next chart shows the rollercoaster that investor emotion traces through the course of an investment cycle. Once a cycle turns down in a bear market, euphoria gives way to anxiety, denial, capitulation and ultimately depression, at which point the asset class is underloved and undervalued, and everyone who is going to sell has – and it becomes vulnerable to good (or less bad) news. This is the point of maximum opportunity.
Once the cycle turns up again, depression gives way to hope and optimism before eventually seeing euphoria again.
Source: Russell Investments, AMP Capital
Key message: Investor emotion plays a huge role in magnifying the swings in investment markets. The key for investors is not to get sucked into this emotional rollercoaster. Of course, doing this is easier said than done, which is why many investors end up getting wrong-footed by the investment cycle.
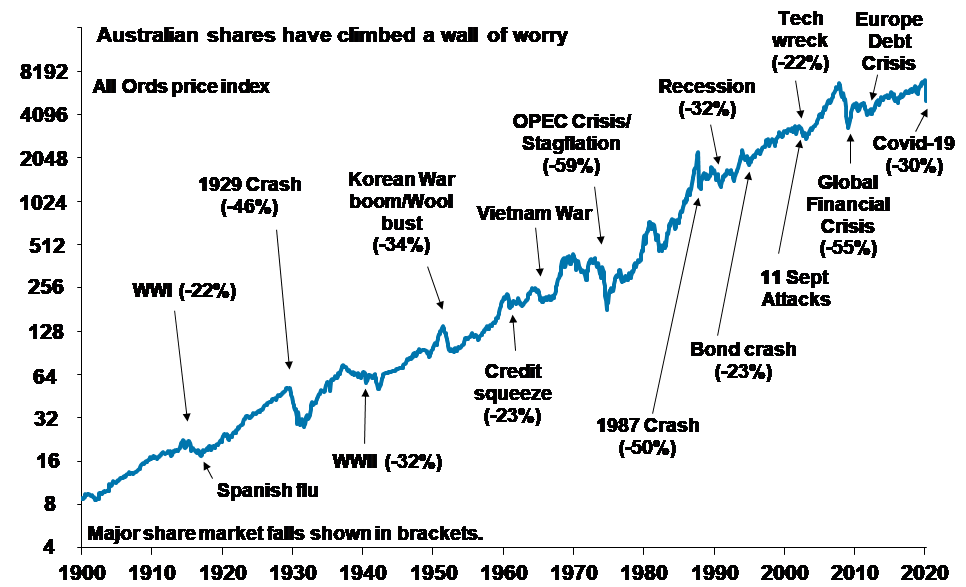
Chart 4: The wall of worry
There is always something for investors to worry about, and in a world where social media is competing intensely with old media it all seems more magnified and worrying. This is arguably evident now in relation to coronavirus uncertainty.
The global economy has had plenty of worries over the last century but it got over them, Australian shares returning 11.5 per cent per annum since 1900 with a broad rising trend in the All Ords price index, as can be seen in the next chart, and US shares returning 9.6 per cent per annum. (Note this chart shows the All Ords share price index, whereas the first chart shows the value of $1 invested in the All Ords accumulation index, which allows for changes in share prices and dividends.)
Key message: Worries are normal around the economy and investments, and sometimes they become intense – like now. But they eventually pass. For example, back in mid-January it seemed the bushfires, smoke shrouding our cities and regular news of homes and lives lost would never end. So it is with coronavirus; this also will pass eventually.
Source: ASX, AMP Capital
Chart 5: Timing is hard
The temptation to time markets is immense. With the benefit of hindsight many swings in markets like the tech boom and bust and the GFC look inevitable and hence can be forecast, so it is natural to think why not switch between, say, cash and shares within your super to anticipate market moves.
This is particularly the case in times of emotional stress like now when all the news around coronavirus and its impact on the economy is bad. Fair enough if you have a process and put the effort in.
But without a tried and tested market timing process, trying to time the market is difficult. A good way to demonstrate this is with a comparison of returns if an investor is fully invested in shares versus missing out on the best (or worst) days. The next chart shows that if you were fully invested in Australian shares from January 1995 you would have returned 8 per cent per annum (with dividends but not allowing for franking credits, tax and fees).
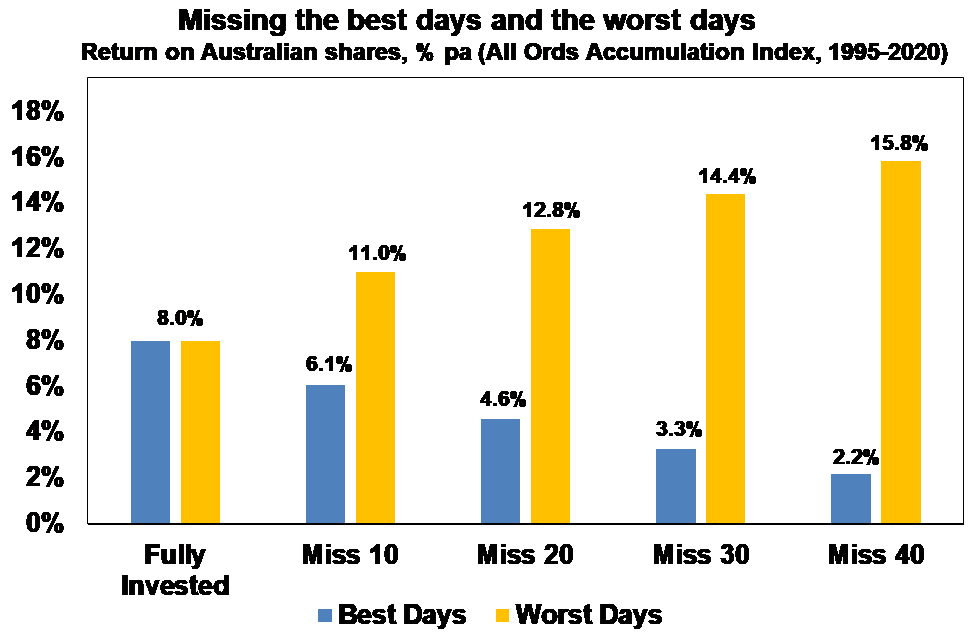
Covers Jan 1995 to 17 March 2020. Source: Bloomberg, AMP Capital
If by trying to time the market you avoided the 10 worst days (yellow bars), you would have boosted your return to 11 per cent per annum. If you avoided the 40 worst days, it would have been boosted to 15.8 per cent per annum.
But this is very hard and many investors only get out after the bad returns have occurred, just in time to miss some of the best days. For example, if by trying to time the market you miss the 10 best days (blue bars), the return falls to 6.1 per cent per annum. If you miss the 40 best days, it drops to just 2.2 per cent per annum.
Key message: Trying to time the sharemarket is not easy.
About the author
ASX acknowledges the Traditional Owners of Country throughout Australia. We pay our respects to Elders past and present.
Artwork by: Lee Anne Hall, My Country, My People
