Adding alpha with small-mid cap futures
- Tue 16 July 2024
- 3 MIN READ

Coinciding with the launch of ASX small-mid cap future, Sean Freer at S&P Dow Jones Indices published some insights into the S&P/ASX 200 Ex-S&P/ASX 100 Index. The S&P/ASX 200 ex 100 Gross Total Return Index Futures differ from the ASX SPI 200 Index Futures because they account for dividend reinvestment and track the small to mid-cap companies (100+) of the S&P/ASX 200 Index. They enable customers to replicate their total return benchmark needs in a single transaction.
This article was first published on S&P Dow Jones Indices Indexology Blog dated 15 July 2024.
The S&P/ASX Index for ‘larger’, more liquid small caps
What would you get if you carved out the 100 smallest companies in the S&P/ASX 200 into their own index? You’d have the S&P/ASX 200 Ex-S&P/ASX 100 Index. Alternatively, you’d have also segmented the largest 100 companies in the S&P/ASX Small Ordinaries.
Companies listed on the ASX are grouped into broad market, large-, mid- and small-cap segments; these segments are represented by S&P DJI's suite of S&P/ASX Indices, including the S&P/ASX50, S&P/ASX100, S&P/ASX200, S&P/ASX300, S&P/ASX MidCap 50 and the S&P/ASX Small Ordinaries. However, there is less awareness of the S&P/ASX 200 Ex-S&P/ASX 100 Index, which is gaining traction as a more liquid "big brother" to the S&P/ASX Small Ordinaries.
Exhibit 1: Key Indices from S&P/ASX Index Series
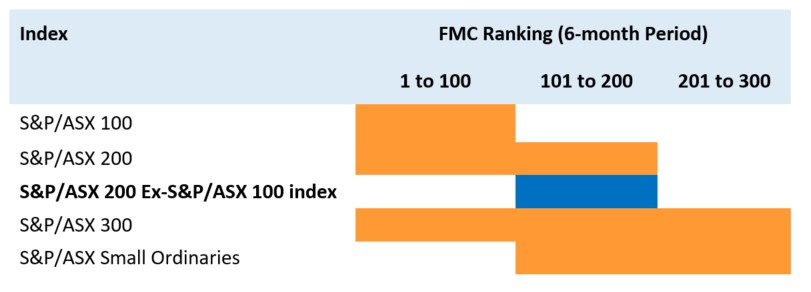
Data source: S&P Dow Jones Indices LLC. Data as of June 30, 2024. Table is provided for illustrative purposes.
More meaningful representation of ‘larger’ small-cap companies
In terms of the number of constituents, the bottom half of the S&P/ASX 200 currently represents less than 10% of its index weight. Meanwhile, the top half of the S&P/ASX Small Ordinaries amounts to nearly 80% of its index weight.
The S&P/ASX 200 Ex-S&P/ASX 100 Index measures the 100 larger small-cap constituents, with added representation compared to the broader small-cap index. For example, while the top 10 companies in the S&P/ASX 200 Ex-S&P/ASX 100 Index and the S&P/ASX Small Ordinaries are the same, in the S&P/ASX 200 Ex-S&P/ASX 100 Index they comprised 19.29% of the index weight compared to 14.87% in the broader small-cap index, as of Q2 2024.
Exhibit 2: Cumulative weight of constituents by ranking
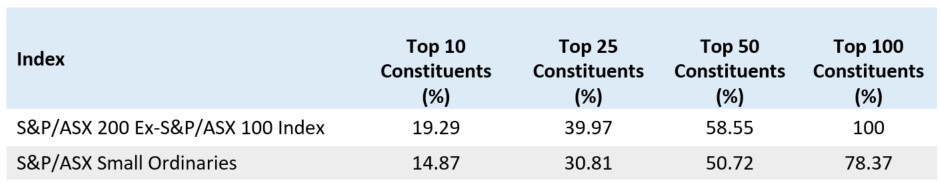
Data source: S&P Dow Jones Indices LLC. Data as of June 30, 2024. Table is provided for illustrative purposes.
Improved sector diversification outside the top 100
It’s well known the big banks and large miners represent large index weights within the S&P/ASX 200. In fact, the Financials and Materials sectors alone comprise of over 50% of Australia’s flagship large-cap index.
Because it removes the top 100 companies, the S&P/ASX 200 Ex-S&P/ASX 100 Index has significantly less weight in Financials and has more representation to companies within the Consumer Discretionary, Energy and Information Technology sectors. As expected, sector weights for the S&P/ASX 200 Ex-S&P/ASX 100 Index are similar to the S&P/ASX Small Ordinaries, but with slightly more representation to the Consumer Discretionary and Energy sectors and less representation in Information Technology companies.
Exhibit 3: GICS® Sector Weights
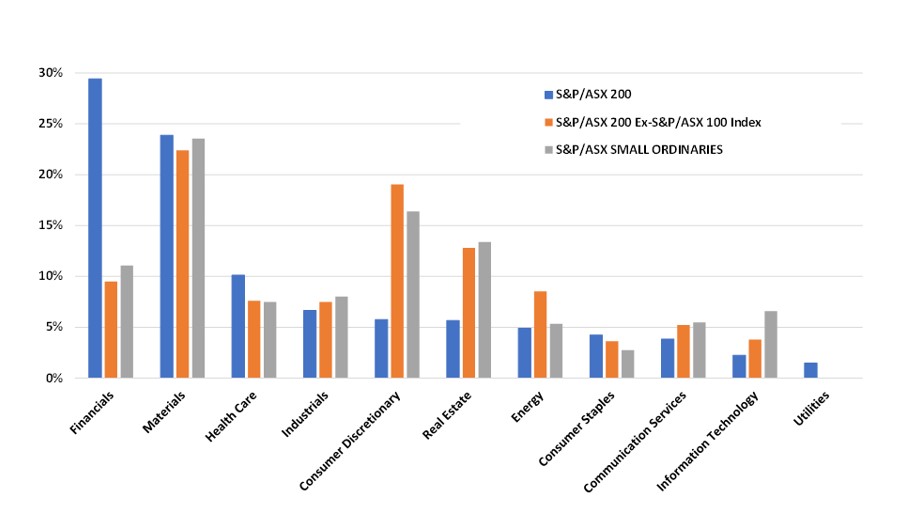
Data source: S&P Dow Jones Indices LLC. Data as of June 30, 2024. Chart is provided for illustrative purposes
Large caps have driven recent market performance
In terms of risk/return characteristics, sector weights and tracking error, the S&P/ASX 200 Ex-S&P/ASX 100 Index aligns closely to the S&P/ASX Small Ordinaries. Australian large caps have outperformed small caps YTD and over the one-year period (see Exhibit 4). Consequently, the S&P/ASX 200 Ex-S&P/ASX 100 Index has slightly outperformed the S&P/ASX Small Ordinaries. Conversely, in markets where small caps lead performance, we would expect the broader S&P/ASX Small Ordinaries to outperform.
Exhibit 4: Performance Comparison

Data source: Source: S&P Dow Jones Indices LLC. Data as of June 30, 2024. Index performance based on total return in AUD. Risk data calculated using the standard deviation of monthly total returns. The S&P/ASX 200 ex-S&P/ASX 100 Index was launched Nov 1, 2017. All data prior to index launch date is back-tested hypothetical data. Past performance is no guarantee of future results. Table is provided for illustrative purposes and reflects hypothetical historical performance. Please see the Performance Disclosure linked at the end of this post for more information regarding the inherent limitations associated with back-tested performance.
More liquidity to be found in the ‘larger’ small caps
While its risk/return characteristics have been closely aligned with the S&P/ASX Small Ordinaries, the S&P/ASX 200 Ex-S&P/ASX 100 Index has some significant differences in terms of company size and liquidity.
As of June 30, 2024, the total index market cap of the S&P/ASX 200 Ex-100 Index was AUD 190.6 billion, which comprises approximately 78% of the AUD 247.3 billion for the S&P/ASX Small Ordinaries. The average and median sized companies in the S&P/ASX 200 Ex-S&P/ASX 100 Index are 1.5 times and 1.6 times larger than the S&P/ASX Small Ordinaries, while the smallest company is more than 4 times larger.
Exhibit 5: Market capitalization statistics

Data source: S&P Dow Jones Indices LLC, Factset. Data as of June 30, 2024. Metrics based on AUD millions. Note: some of the index constituents as of June 30, 2024, may not have been part of the S&P/ASX 200 Ex-S&P/ASX 100 Index or S&P/ASX Small Ordinaries for the whole 12-month calculation period. Past performance is no guarantee of future results. Table is provided for illustrative purposes.
Size matters when it comes to liquidity, and constituents in the S&P/ASX 200 Ex-S&P/ASX 100 Index have generally offered better liquidity than the 200-stock small-cap benchmark. For example, over a one-year period to June 30, 2024, the average and median constituent in the S&P/ASX 200 Ex-S&P/ASX 100 Index traded more than AUD 500 million compared to the S&P/ASX Small Ordinaries. When looking at daily value traded over the past three-months to June 30, 2024, constituents in the S&P/ASX 200 Ex-S&P/ASX 100 Index traded about 1.5 times more than the broader S&P/ASX Small Ordinaries.[1]
Conclusion
The S&P/ASX 200 Ex-S&P/ASX 100 Index provides market participants with a measurement of the top-end of the Australian small-cap segment and has had a similar historical risk/return profile as the more well-known S&P/ASX Small Ordinaries. The S&P/ASX 200 Ex-S&P/ASX 100 Index can be seen as a “larger” small-cap index, offering half the constituents as the S&P/ASX Small Ordinaries but with a significantly improved liquidity profile historically.
[1] Source: Factset, using median and average daily value traded for each index constituent as of June 28, 2024 (last trading day of June).
This article was first published on S&P Dow Jones Indices Indexology Blog dated 15 July 2024.
_______________________________________________________________________________________________
Futures provide an efficient way to gain exposure
For traders looking to participate in these market trends, trading the small-mid cap future provides access and exposure without the added burden of owning and managing the individual stocks. Furthermore, futures can be an appropriate and efficient way to carry out these strategies as they are equipped to manage the risk associated with these stocks.
The small-mid cap futures have a $25 matching the SPI futures contract – making inter-market spreads available. When trading futures, market participants can also enjoy added benefits, like ASX’s centrally cleared platform, margin offsets when trading across the index futures suite.
Vendor Codes
Bloomberg: XJSA
Refinitiv: <0#YAS:>
IRESS: ASmy
Liquidity providers
- Citi
- JP Morgan
- UBS
- BNP
- Morgan Stanley
Other Insights
To receive regular insights via email, please subscribe to the ASX Equity Derivatives monthly newsletter.
Insights
Equity options trading observations and insights
ASX have partnered with Dr Russell Rhoads to create a series of articles which provide observations and insights for options trading.
Disclaimer
The views, opinions or recommendations of the author in this article are solely those of the author and do not in any way reflect the views, opinions, recommendations, of ASX Limited ABN 98 008 624 691 and its related bodies corporate (“ASX”). ASX makes no representation or warranty with respect to the accuracy, completeness or currency of the content. The content is for educational purposes only. Examples used are intended to detail the performance of historic trading strategies. Past performance is not a reliable indicator of future performance. The content does not constitute financial advice. Independent advice should be obtained from an Australian financial services licensee before making investment decisions. To the extent permitted by law, ASX excludes all liability for any loss or damage arising in any way including by way of negligence. © Copyright ASX Operations Pty Limited ABN 42 004 523 782. All rights reserved 2024.