
At-The-Money or Out-Of-The Money: What’s Better When Selling Index Options?
- Tue 04 June 2024
- 3 MIN READ

I have been writing about S&P/ASX 200 index options for over a year, mostly focusing on trades of interest. We have also been conducting research in the behaviour of S&P/ASX 200 options, specifically short-dated options. Our findings were surprising, but also offer some trading opportunities.
Conventional wisdom with respect to the option market is that over a long period of time options are slightly overpriced. However periodically, options sellers, who are trying to take advantage of this aspect of option pricing, will incur substantial losses. Another aspect of option pricing notes that at-the-money (‘ATM’) options have more time value than out-of-the-money (‘OTM’) options. Based on this, traders tend to look to ATM contracts when selling. We explored this a bit and in the S&P/ASX 200 market, this has not held true, at least over the past three plus years.
Methods
Our testing started with selling one week, ATM straddles on the Thursday close. And we held the position through cash settlement to the following Thursday. For option pricing we recorded the mid-point of the bid-ask spread near the close on trading days. Do keep in mind no trading costs or slippage are included in these results and of course past performance is never an indication of future results. Our goal is to determine if selling ATM or OTM options is a better approach to taking advantage of option overpricing.
Results
In addition to ATM straddles we looked at two OTM levels, 50-points from the ATM strike and 100-points from the ATM strike. The table below is an example of pricing from 29 September 2022 using options expiring 6 October 2022.
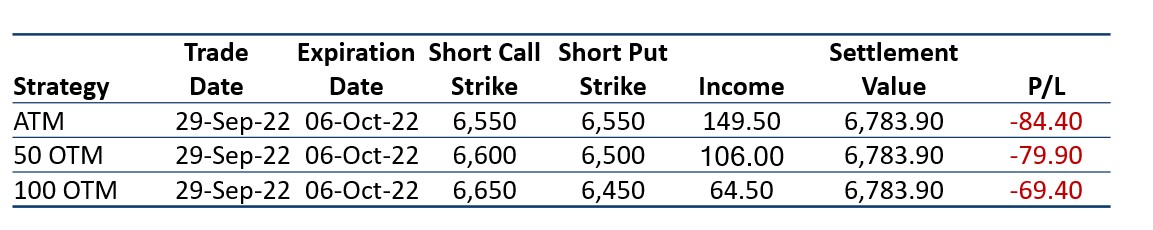
Data sources: Bloomberg and Author calculations
These three short option positions (one straddle, two strangles) may have done well if the underlying index did not experience higher than expected volatility over the following five trading days. In this case, the market moved up by about 3.5% in five trading sessions. That price action resulted in losses for all three scenarios. The ATM straddle performed the worst, while the farthest out of the money strangle was the best performer via losing less than the other two strategies. The payoff diagram below shows the outcome for each trade based on holding through settlement.
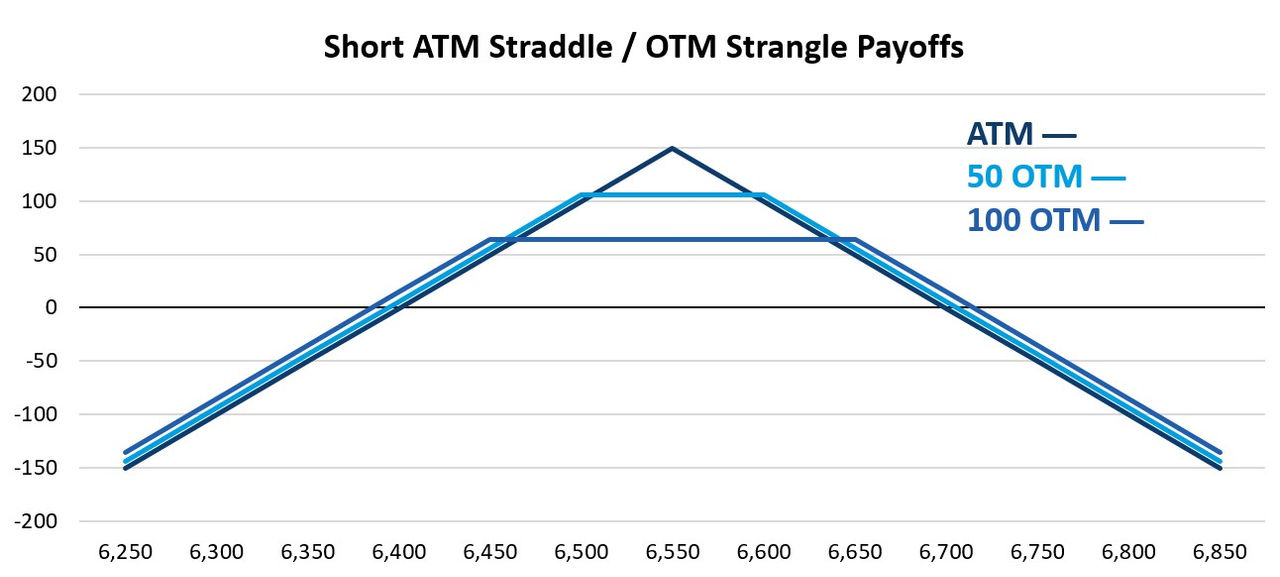
Data sources: Bloomberg and Author calculations
The possibility of realising a profit equal to the premium received when selling options is very low for the ATM straddle versus the OTM versions. Do note, all three strategies concerning straddles and strangles can result in substantial losses due to the unlimited risk nature of the trade. It's important to consider measures to limit losses and the risk vs the return when initiating a trade that is based on the underlying market staying in a range.
As noted above, the ATM straddle was the biggest loser in our example trade. This coincides with our findings that options sellers may want to consider looking to OTM strikes when putting on a position. The graphic below shows the performance for each of the three approaches if consistently traded using each weekly expiration starting with 7 January 2021 and ending on 24 April 2024.
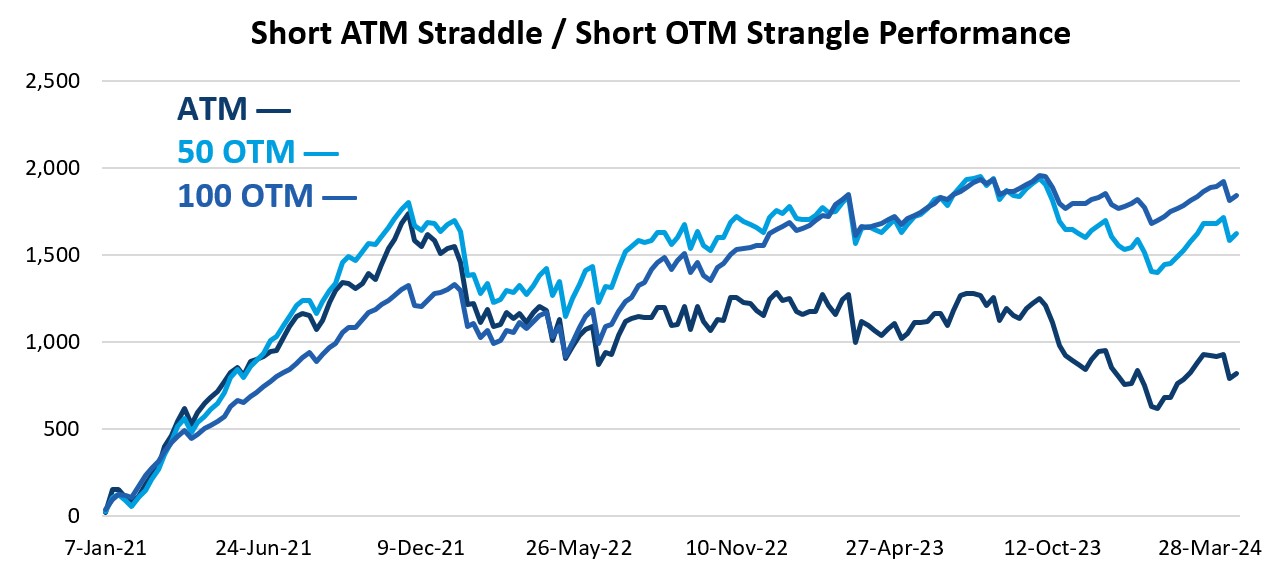
Data sources: Bloomberg and Author calculations
As noted at the start of this post, we were surprised at the outcome. Note selling the ATM straddle has not done well since early 2022 while the other two strategies have managed to offer increased profits over the same period. All approaches experience drawdowns which may be expected for systematic short option trading, but using OTM options as opposed to ATM seems to offer more consistent returns.
Turning to trades worth discussing, one hit the tape on 21 May 2024 with the S&P/ASX 200 at 7851. One trader believes the index will remain over 7650 through July 2024 expiration and expressed this outlook by selling almost 3,000 July 2024 7650 Puts for 59.25 and buying the same number of July 2024 7300 Puts for 19.60 taking in a credit of 39.65 and a payoff on 18 July 2024 that appears below.

Data sources: Bloomberg and Author calculations
There is a nice buffer for this trade at just over 3% between where the index was at trade execution and break-even. The maximum profit is 39.65, as long as the index is over 7650 at expiration and maximum potential loss is 310.35. It is likely that the trade behind this bull put spread has a price where they may consider exiting the trade before the market approaches 7300. At least we hope they are not risking 310.35 to make 39.65.
Other Insights
To receive regular insights via email, please subscribe to the ASX Equity Derivatives monthly newsletter.
Insights
Equity options trading observations and insights
ASX have partnered with Dr Russell Rhoads to create a series of articles which provide observations and insights for options trading.
About the author
Disclaimer
The views, opinions or recommendations of the author in this article are solely those of the author and do not in any way reflect the views, opinions, recommendations, of ASX Limited ABN 98 008 624 691 and its related bodies corporate (“ASX”). ASX makes no representation or warranty with respect to the accuracy, completeness or currency of the content. The content is for educational purposes only. Examples used are intended to detail the performance of historic trading strategies. Past performance is not a reliable indicator of future performance. The content does not constitute financial advice. Independent advice should be obtained from an Australian financial services licensee before making investment decisions. To the extent permitted by law, ASX excludes all liability for any loss or damage arising in any way including by way of negligence. © Copyright ASX Operations Pty Limited ABN 42 004 523 782. All rights reserved 2024.