Bullish
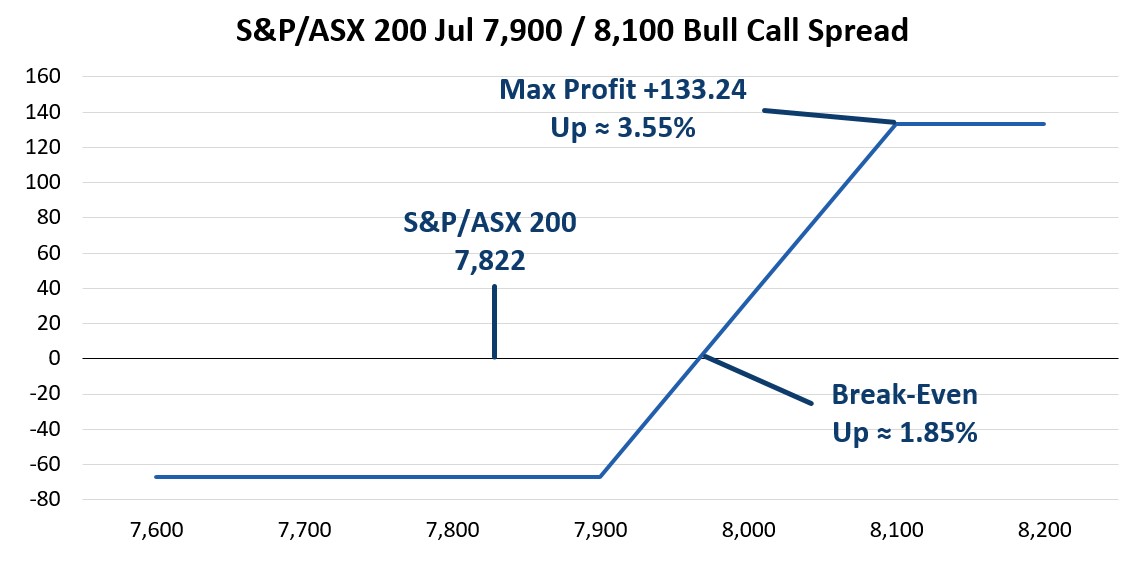
On 6 June, with the S&P/ASX 200 at 7,822, a trader initiated a bullish trade expecting a strong push for stocks through mid-July. The specific trade bought over 800 Jul 7900 Calls for 97.35 which also sold the Jul 8,100 Calls for 30.59 resulting in a net cost of 66.76 per bull call spread.

Data sources: Bloomberg and Author calculations
The target for this trade is 8,100, which is about 190 points higher than the current all-time high. Note the short strike (8,100) for the bull call spread is 3.55% higher than where the index was quoted at trade execution. To break even on this trade, the S&P/ASX 200 should be at 7,966.76 or 1.85% higher which is a reasonable move, but like the 8,100-target level represents an index all-time high.
Bearish Trade
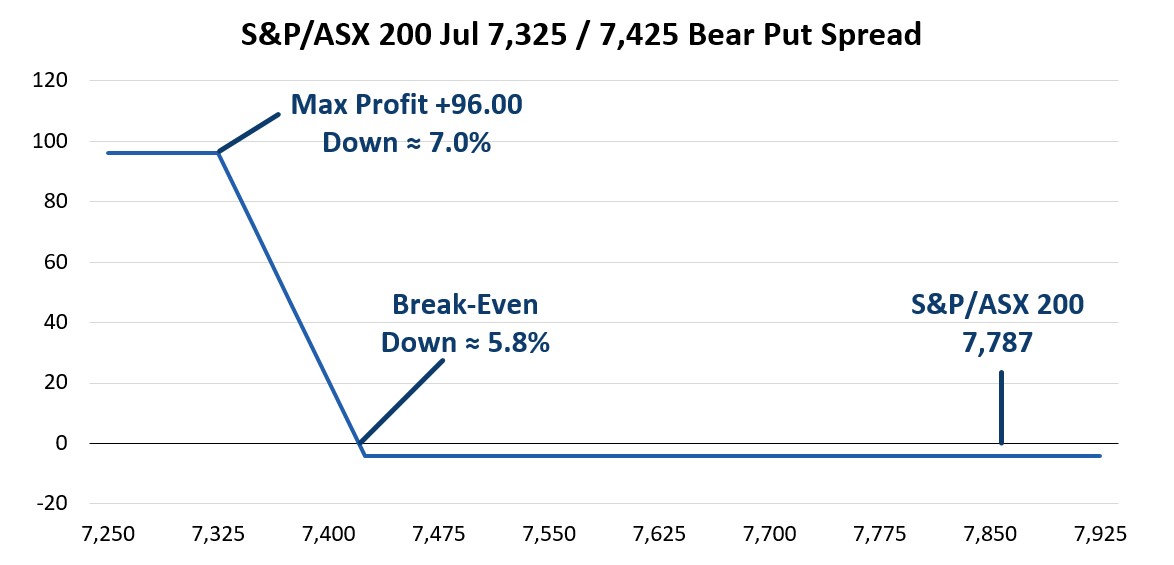
Our bearish trade may be a hedge or speculation for a move lower. This potential downside protection hit the tape on 21 June with the S&P/ASX 200 around 7,787. A trader purchased 300 Jul 7,425 Puts for 11.00 each, selling the same number of Jul 7,325 Puts for 7.00 each. The result is a bear put spread priced at 4.00 and a payoff at expiration appearing below.

Data sources: Bloomberg and Author calculations
Of the four trades (there’s a bonus trade at the end) discussed in this blog, this one has the highest likelihood of not working out. This is not an opinion, just an observation as the break-even level is down 5.8% and maximum profit level is down 7.0%. Of course, the risk of 4.00 related to the potential reward of 96.00 is very attractive to anyone that expects a substantial drop in stock prices over the next few weeks.
Neutral Trade
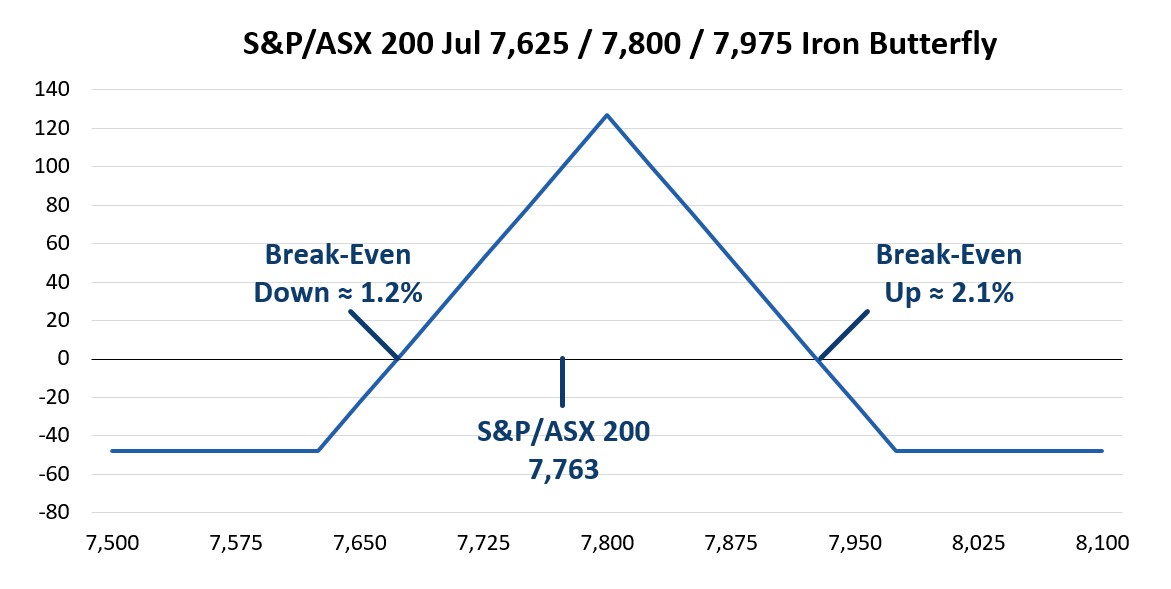
As noted, the S&P/ASX 200 has been mostly range bound as of late. However, for full disclosure, finding a suitable neutral trade over the past few weeks was a challenge. We did find a trade on 13 June that has a narrow range of profitability based on where the index closes at standard July expiration. The specific trade sold the Jul 7,800 Put for 108.00 and Jul 7,800 Call for 102.00. This iron butterfly was completed as the trade purchased the Jul 7625 Put for 48.00 and Jul 7975 Call for 35.00 resulting in a net credit of 127.00.

Data sources: Bloomberg and Author calculations
This trade was executed when the index was around 7,763 which places the upside break-even at +2.1% and downside break-even around -1.2%. This is a tight range, but we checked recent S&P/ASX 200 closing prices and felt a bit better about this trade. With just three trading days remaining in June, the index has closed between these two break-even levels every trading day for the month. If the index remains in this range for a few more weeks, this trade will turn out fine.
Bonus Hedge Trade
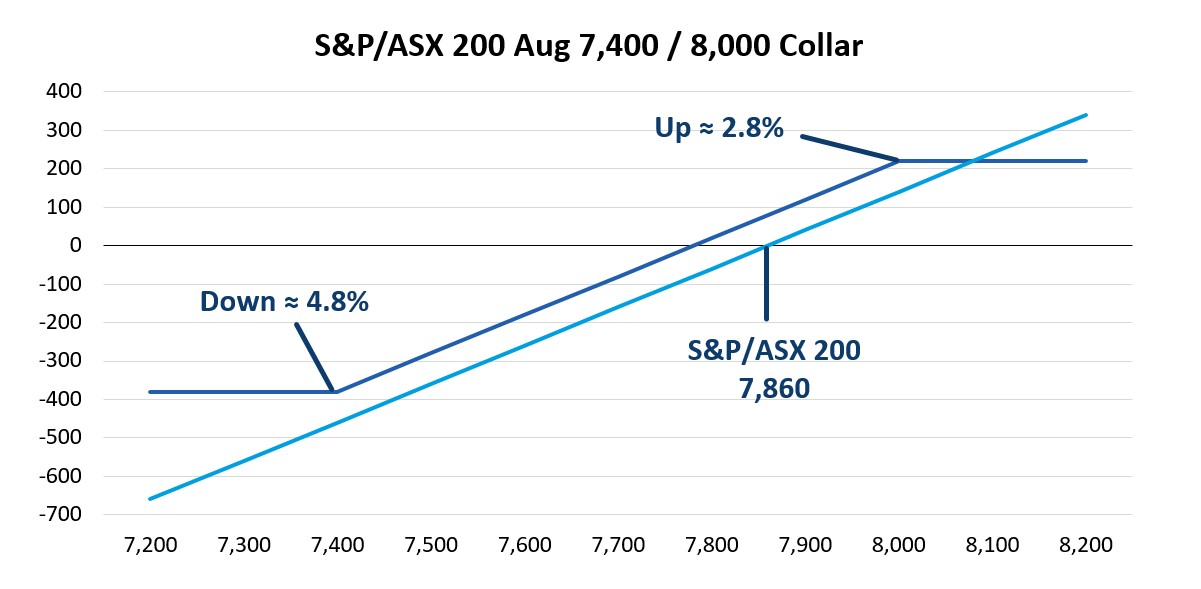
The headline mentions three types of trades however, we came across a collar that we found interesting. On 7 June with the S&P/ASX 200 at 7,860 there was seller of 100 Aug 8,000 Calls for 110.00 who also purchased 100 Aug 7400 Puts for 30.00 resulting in a credit of 80.00. The payoff at August expiration, assuming this is combined with a long equity portfolio appears below.

Data sources: Bloomberg and Author calculations
By putting this trade on with a credit of 80.00 points this trade increases the hedged portfolio’s return by just over 1%. When we see a collar, we like to see them executed with a credit which enhances returns. To the upside, if the index is at 8,000 or higher at August expiration, the net result is a gain of 2.8%. To the downside losses are capped at 4.8% with the index at 7,400 or lower. In addition to the trade being done at a credit, this trade sells call options with a strike price higher than the all-time index high, another factor that compelled us to share this trade.
Other Insights
To receive regular insights via email, please subscribe to the ASX Equity Derivatives monthly newsletter.
Equity options trading observations and insights
ASX have partnered with Dr Russell Rhoads to create a series of articles which provide observations and insights for options trading.
Disclaimer
The views, opinions or recommendations of the author in this article are solely those of the author and do not in any way reflect the views, opinions, recommendations, of ASX Limited ABN 98 008 624 691 and its related bodies corporate (“ASX”). ASX makes no representation or warranty with respect to the accuracy, completeness or currency of the content. The content is for educational purposes only. Examples used are intended to detail the performance of historic trading strategies. Past performance is not a reliable indicator of future performance. The content does not constitute financial advice. Independent advice should be obtained from an Australian financial services licensee before making investment decisions. To the extent permitted by law, ASX excludes all liability for any loss or damage arising in any way including by way of negligence. © Copyright ASX Operations Pty Limited ABN 42 004 523 782. All rights reserved 2024.

