
Directional outlooks traded using neutral spreads for index options
- Thu 08 August 2024
- 3 MIN READ

Neutral spreads like the iron condor or iron butterfly are two trading strategies that we’ve observed for index options. These strategies are generally thought of as appropriate for trading a range bound market. However, these strategies may also be used when there is a direction outlook for an underlying market.
Broken wing butterfly
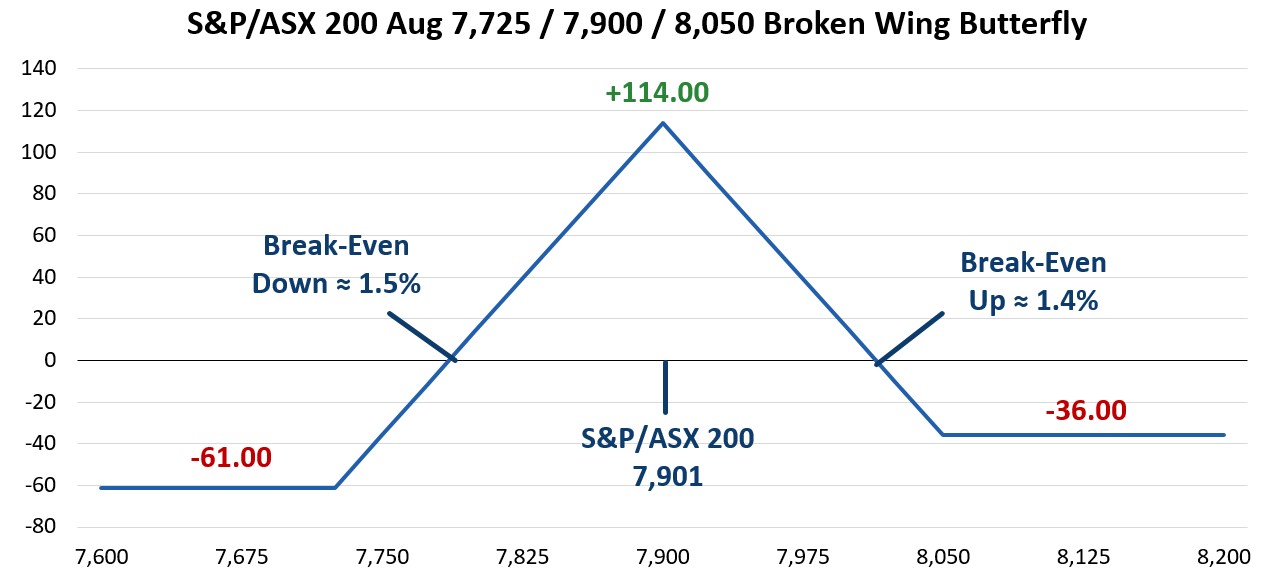
An example of this occurred on 25 July with the S&P/ASX 200 at 7,901. A trader created a spread by selling the 15 Aug 7,900 Puts for 92.00 and 15 Aug 7,900 Calls for 100.00. The trader also purchased the 15 Aug 7,725 Puts for 38.00 and bought the 15 Aug 8,050 Calls for 40.00 with the result being a credit of 114.00 and a payoff at August expiration that appears below.
Data sources: Bloomberg and Author calculations
This trade has a slight twist to it relative to a standard butterfly as the distance between the short strikes and long strikes is not equal. Specifically, the long put strike is 175 points lower, while the long call is 150 points higher. The result is more downside risk at a potential loss of 61.00 points if the index is below 7,725 at expiration versus a maximum loss of 36.00 points if the index is over 8,050. The break-even levels are down 1.5% and up 1.4% and the maximum potential profit is 114.00 points if the index lands right at the short strike of 7,900.
The trader behind this first example is anticipating the S&P/ASX 200 staying in range through August expiration. However, the structure of the trade may indicate they are more concerned with the index moving higher versus the index moving lower.
Iron butterfly
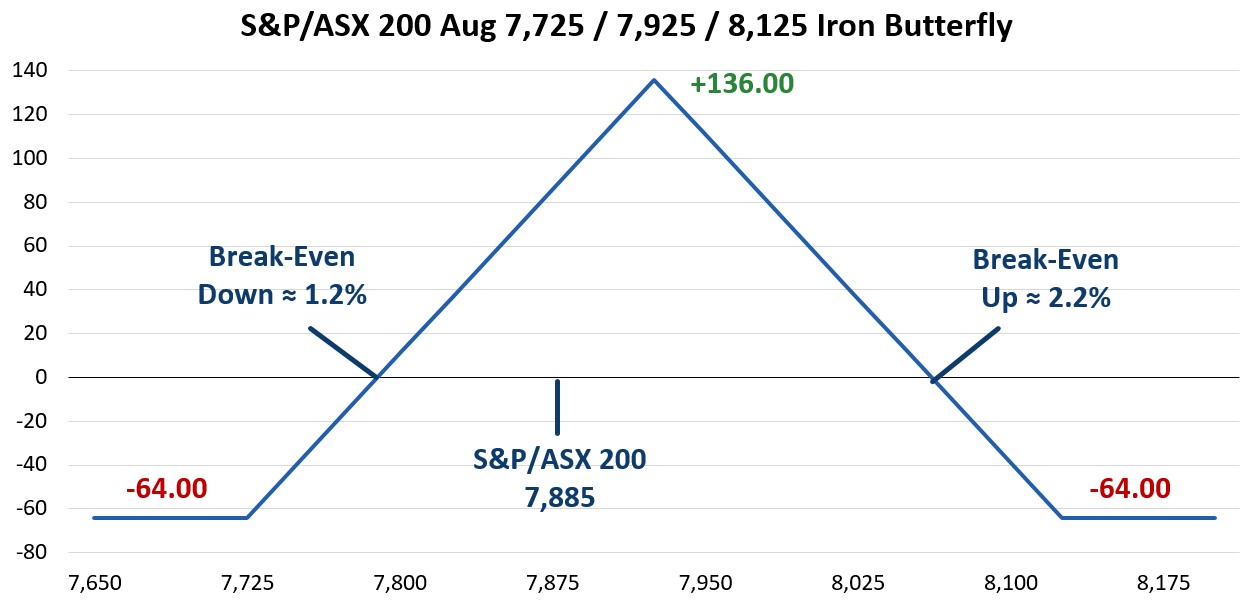
Another slightly directional trade hit the tape on 11 July with the S&P/ASX 200 trading at 7,885. The structure of this trade is iron butterfly with the 15 Aug 7,925 Puts sold at 109.00 and 15 Aug 7,925 Calls sold at 105.00. The trade in completed as the 15 Aug 7,725 Put was purchased for 46.00 and 15 Aug 8,125 Call purchased for 32.00 resulting in a net credit of 136.00.
Data sources: Bloomberg and Author calculations
Unlike the broken wing butterfly, this trade has equivalent potential loss in both directions with a maximum potential loss of 64.00 points if the index is below 7,725 or above 8,125 at expiration. The imbalance in this case is where the market is relative to the short strikes. Since the market is 40.00 points below the short strikes, the downside break-even is 1.2% lower, while the upside break-even is 2.2% higher. Much like the first trade, this trade may be positioned better if the market moves higher versus lower.
Put butterfly
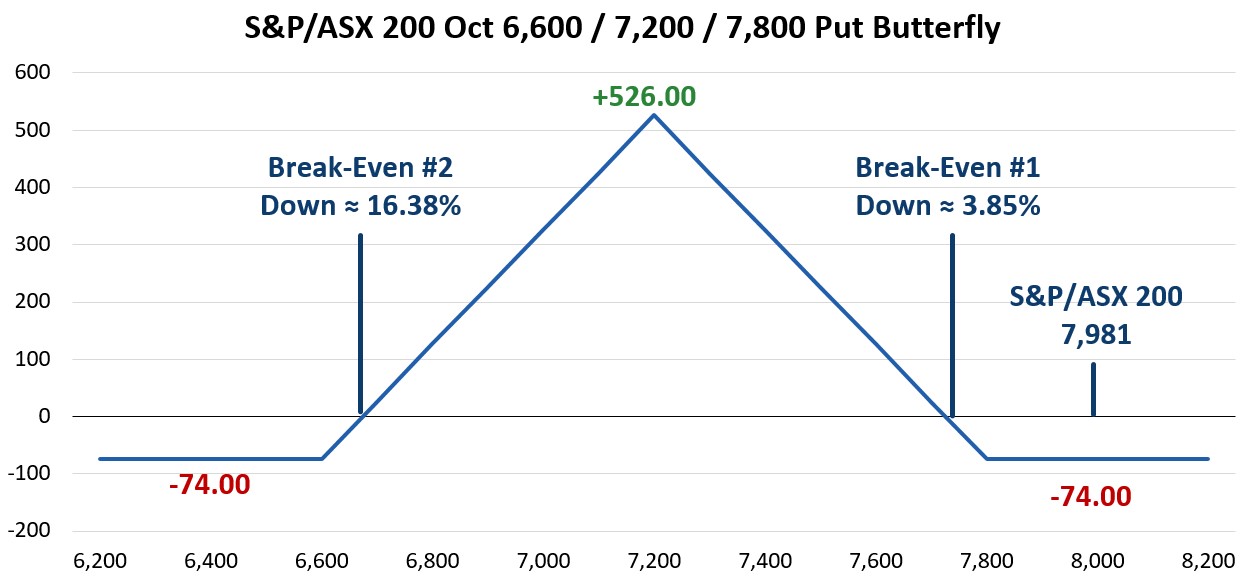
A final butterfly of interest hit the market on 23 July with the index at 7,981. A trader purchased 128 17 Oct 7,800 Puts for 120.00, sold 256 17 Oct 7,200 Puts for 28.00, finishing the trade through purchasing 128 17 Oct 6,600 Puts for 10.00, resulting in a net cost of 74.00. The outcome at October expiration appears below.
Data sources: Bloomberg and Author calculations
Unlike the first two butterfly examples outlined above, this trade was executed with the underlying market outside of the range of profitability. This trade appears to benefit from a drop in the index between 3.85% and 16.38%. The anticipated scenario is October settlement where the spread would profit by 526.00 points. Although the butterfly structure is neutral, it may be applied with a directional outlook.
Iron Condor
The other common neutral trade is the iron condor. An example of this occurred on 19 July with the index at 7,936. The trader sold 200 15 Aug 7,650 Puts for 22.00 and 15 Aug 8,050 Calls for 60.00. The trade was completed through buying 200 15 Aug 7,550 Puts for 14.00 and 200 15 Aug 8,150 Calls for 31.00. The net result is a credit of 37.00 per iron condor.

Data sources: Bloomberg and Author calculations
The goal for this iron condor is the index between 7,650 and 8,050 at August expiration. If this is the case, all options will expire with no value and the trade profit is equal to the initial credit of 37.00 points. A move over 8,150 or below 7,550 will result in a loss of 63.00 points. Finally, it should be noted that there is a wider berth to the downside, with break-even just over 4% lower, while the upside break-even is 1.9% higher. This trader may be more concerned about a downside than upside move into August expiration.
Iron condor with directional bias
Another example is an iron condor that has a directional bias. On 18 July a trader sold the 17 Oct 7,700 Calls for 423.00 and purchased the 17 Oct 7,750 Calls for 384.00. They completed an iron condor by selling the 17 Oct 7,600 Put for 61.00 and buying the 17 Oct 7,550 Put for 54.00 resulting in a credit of 46.00 points. This trade was executed with the S&P/ASX trading at 8,046, over 3% higher than the long call strike of the iron condor.

Data sources: Bloomberg and Author calculations
This trade is very specific with respect to the range of profitability. Basically, this trade returns a 46.00-point profit if the index settles between 7,600 and 7,700 for October contracts. Downside break-even levels are 3.4% to 6.1%, again a narrow range considering the time to October expiration. The dollar risk for this trade is a loss of 4.00 if settlement falls above 7,750 or below 7,550.
Concluding on neutral strategies
As noted, neutral strategies are becoming popular among index option traders who like to choose a potential range for the underlying market. The thought process is often to implement an iron butterfly, iron condor, or a deviation of these strategies with a neutral outlook. However, running through block trades in July, it appears that some index option traders are applying these strategies with directional outlooks as well.
Other Insights
To receive regular insights via email, please subscribe to the ASX Equity Derivatives monthly newsletter.
Insights
Equity options trading observations and insights
ASX have partnered with Dr Russell Rhoads to create a series of articles which provide observations and insights for options trading.
About the author
Disclaimer
The views, opinions or recommendations of the author in this article are solely those of the author and do not in any way reflect the views, opinions, recommendations, of ASX Limited ABN 98 008 624 691 and its related bodies corporate (“ASX”). ASX makes no representation or warranty with respect to the accuracy, completeness or currency of the content. The content is for educational purposes only. Examples used are intended to detail the performance of historic trading strategies. Past performance is not a reliable indicator of future performance. The content does not constitute financial advice. Independent advice should be obtained from an Australian financial services licensee before making investment decisions. To the extent permitted by law, ASX excludes all liability for any loss or damage arising in any way including by way of negligence. © Copyright ASX Operations Pty Limited ABN 42 004 523 782. All rights reserved 2024.