
As ASX / S&P 200 climbs hedgers get a little more creative
- Mon 01 May 2023
- 3 MIN READ

As an international equity derivatives subject matter expert, ASX has commissioned me to provide insights into the key trades occurring in the Australian market. This will help you explore trading ideas to guide your investment decisions when considering Australian markets. This is the second article in the series and we’d value your feedback on future topics to be highlighted.
Since we published the first ASX Equity Derivatives blog on 5 April 2023 the ASX/S&P 200 has rebounded to higher levels. As of mid-April the uptrend may be slowing and this has brought out a few hedgers in the ASX/S&P 200 option market. The majority of large hedging transactions in March involved put purchases while we are seeing a bit more creativity with institutions using spreads to lower the cost of protection. This creativity is a function of managers looking for specific protection at a lower cost than purchasing a put. The chart below shows the daily performance of the ASX/S&P 200 through 19 April with the time frame when the trades to be discussed highlighted.
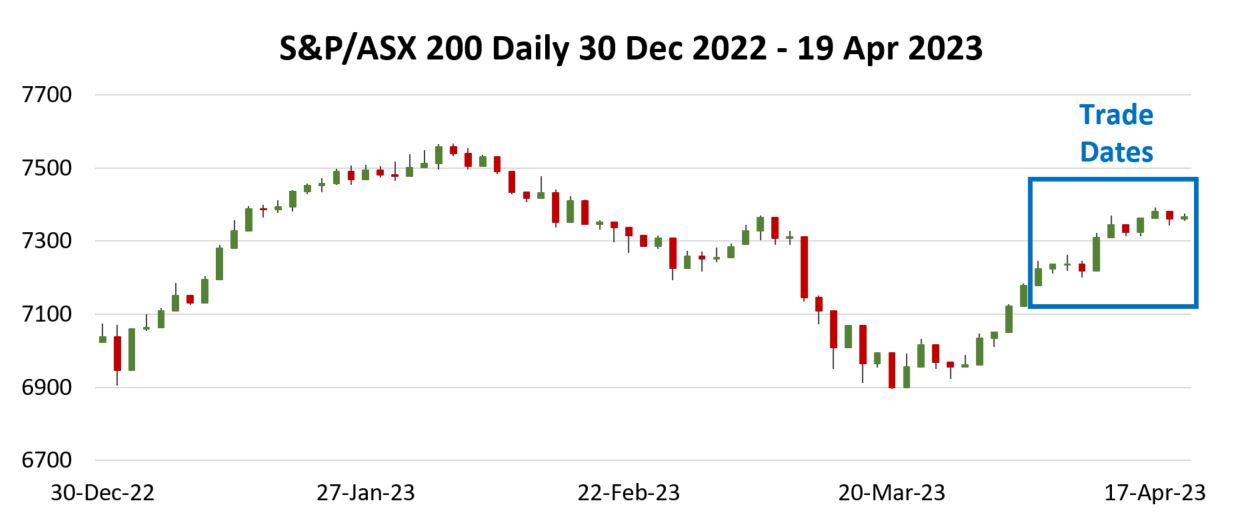
Data Source: Bloomberg
The first trade that caught our eye was executed on 3 April with the index at 7195. An institutional size trade purchased the S&P/ASX 200 18 May 7000 Put for 61.00 and sold the 18 May 6900 Put for 45.00 These two trades sum to a cost of 16.00 points per bear put spread. The payout below shows the outcome at May expiration combined with long exposure to the S&P/ASX 200 Index.
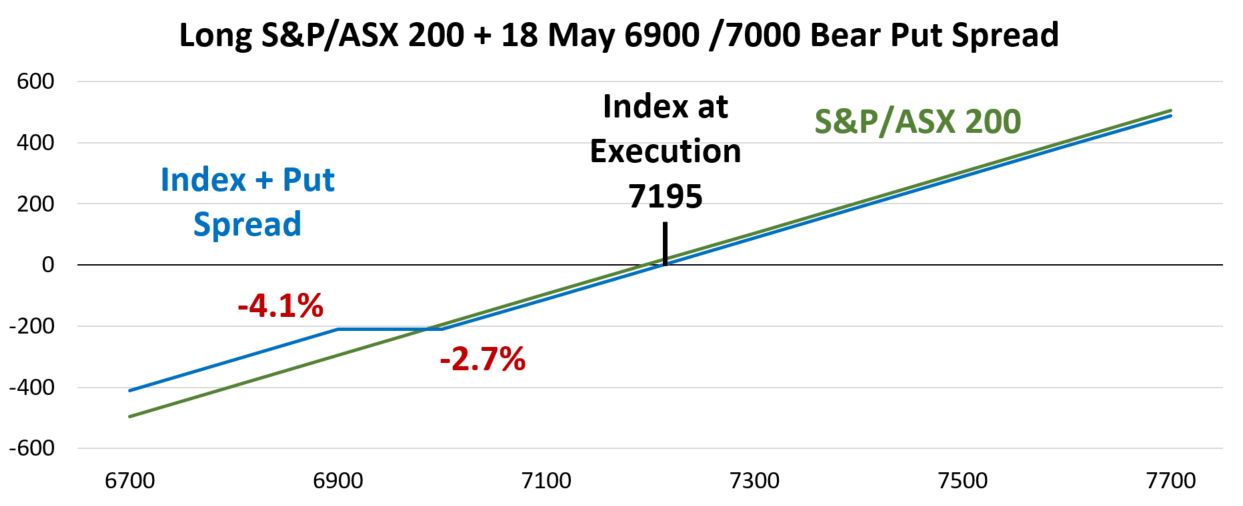
Data Source: Bloomberg
This trade offers very specific portfolio protection, specifically guarding against the index dropping below 7000 and offsetting index losses down to the 6900 level. In percentage terms this is down between 2.7% and 4.1% from the time when the trade was executed. Recall, the cost of the spread was only 16 points which converts to 0.22% of the index. This difference shows up with the green line (representing the index) at a slightly higher level than the combined position until just under the long 7000 strike price in the put spread.
A put spread is one way to get market protection at a lower cost than purchasing a put. A more common approach is a collar. During the first half of April, we came across several collars, which involve selling an out of the money call and using those proceeds to cover some, if not all, of the cost of downside protection.
One collar example was executed on 5 April with the S&P/ASX 200 at 7235. A trade sold the 18 May 7425 Calls for 44.00 and purchased the 18 Pay 7000 Put for 55.60 resulting in a net cost of 11.60 per spread. The payout, based on holding the trade through May expiration shows up below.
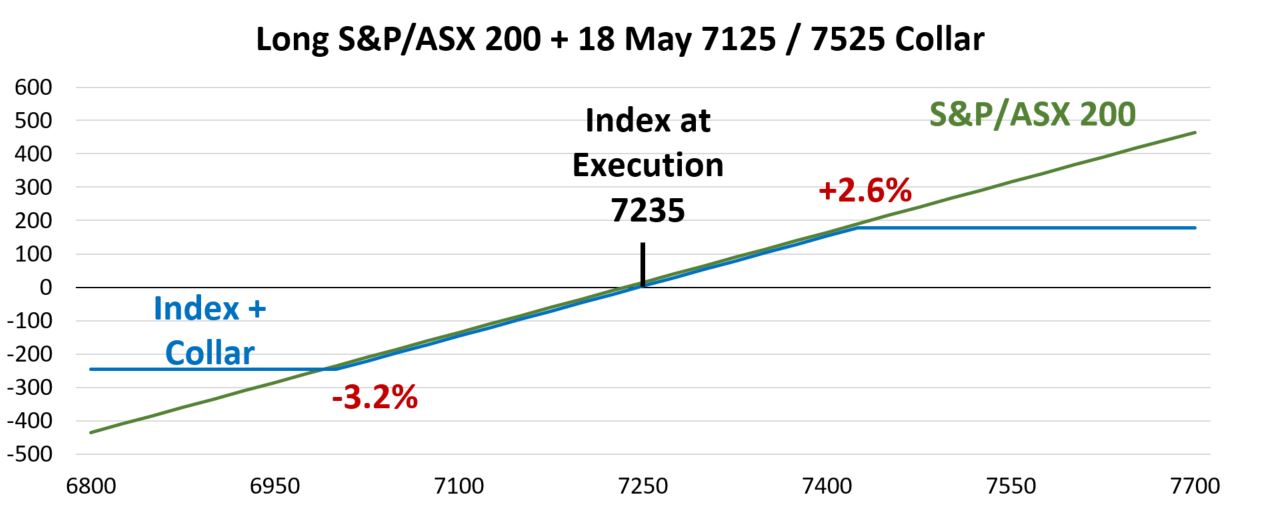
Data Source: Bloomberg
The 11.60 cost of this trade is about 0.016%, which is negligible and would not drag performance up to the short call strike. The important levels for this trade are defined by the two strike prices. The portfolio manager gets low-cost protection from a drop greater than the long put strike. The real cost of a collar is giving up performance greater than the short call strike. For this trade, a manager is giving up performance over 7425 (+2.6%) but has protection against a drop below 7000 (-3.2%).
Another example of a collar was executed on 14 April, with the S&P/ASX 200 at 7345. This collar sold the 18 May 7525 Call for 32.00 and purchased the 18 May 7125 Put for 48.00 and a net cost of 12.00 per spread.
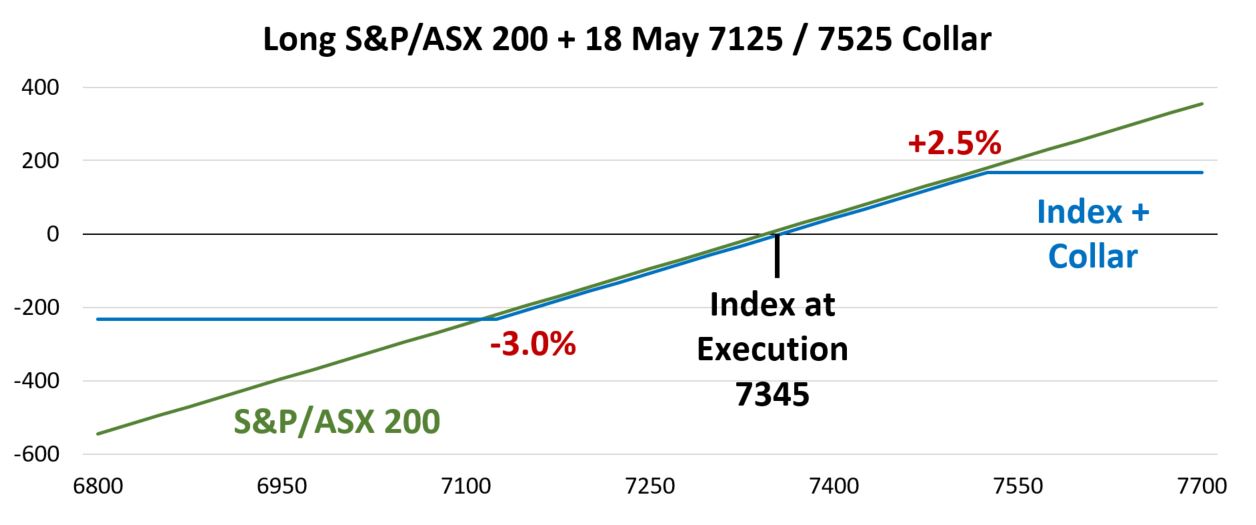
Data Source: Bloomberg
Again, the collar cost of 12.00 is small in percentage terms (0.016%). This second collar was executed with the index at a higher level than the previous one, but the risk / reward is very similar. Portfolio performance is capped at a gain of 2.5% and the long put offers downside protection if the index drops more than 3.0% between the trade date and option expiration on 18 May.
Finally, our focus is on index trading, but sometimes there is a trade that is so interesting I cannot help myself. The trade that has me deviating from the norm was a large call sale that hit the tape on 11 April. With shares of Steadfast Group (SDF) around 6.00 a large call seller, likely selling calls against a long position came into the market. The chart below shows the year-to-date performance for SDF leading up to this day.

Data Source: Bloomberg
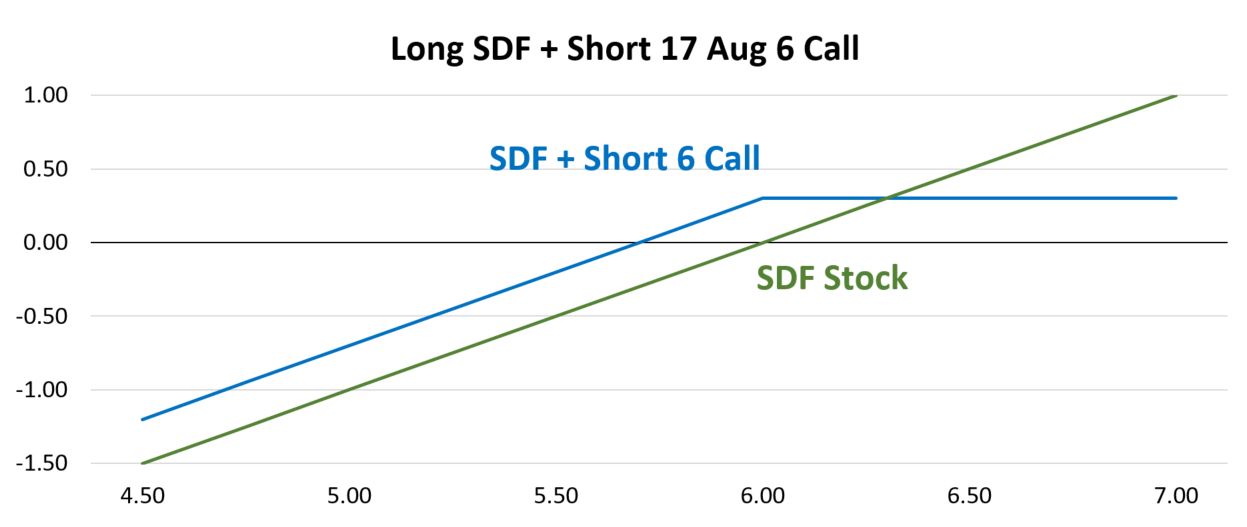
The specific call sell was 55,000 SFD 17 Aug 6 Calls for a credit of 0.30. That results in the option seller having the obligation to sell 5,500,000 shares at 6.00 per share. In exchange for taking on this obligation the seller received 0.30 a share which translates to 5% of the stock price. If called upon to deliver shares, the holder is now limited to a 2023 return of 15.2% return on SDF. The payout below assumes the shares are held to maturity on 17 August.
Data Source: Bloomberg
The profit and loss for SDF, based on the stock price at the time of the trade, is included in this diagram to demonstrate the pros and cons of this option sale. First, the seller is taking in 0.30 which increases the year-to-date performance, but also offers a buffer against some downside. Note the break-even for the covered call is 5.70, which represents the stock dropping by the amount of the premium taken in for the call sale. At any price below 6.00, performance is improved based on selling the call. The downside, like the collars earlier in this blog is sacrificing any upside over the call strike price. We assume the seller of this call would be a seller of their shares at 6.30, the price that shares would be called away plus the premium received when selling the call.
Other insights

After moving higher by over 7% in the first few weeks of 2023, the S&P/ASX 200 index retreated in February and March returning to the same level it started the year. The strong trend from the first few weeks of 2023 lost some steam and started to turn lower in early February. As this downtrend continued to develop, we noticed a few large index put option purchases that cushioned the bearish moves in early March. Learn More
About the author
For more information, contact
Receive the Equity Derivatives newsletter with monthly data and insights
Disclaimer
The views, opinions or recommendations of the author in this article are solely those of the author and do not in any way reflect the views, opinions, recommendations, of ASX Limited ABN 98 008 624 691 and its related bodies corporate (“ASX”). ASX makes no representation or warranty with respect to the accuracy, completeness or currency of the content. The content is for educational purposes only and examples used detail the performance of historic trading strategies, and as such past performance is no guarantee of future performance. The content does not constitute financial advice. Independent advice should be obtained from an Australian financial services licensee before making investment decisions. To the extent permitted by law, ASX excludes all liability for any loss or damage arising in any way including by way of negligence.