
S&P/ASX200 June/Dec call calendar spread breakdown with a neutral view
- Wed 06 March 2024
- 3 MIN READ

In this article we look at a neutral calendar spread using June and December call options that were executed in early February 2024. One of the uses for options is buying one and periodically selling shorter dated options to offset the time value associated with the purchased options. After the initial trade it can be difficult to track any rolling transactions, so we are making assumptions based on outcomes in June 2024.
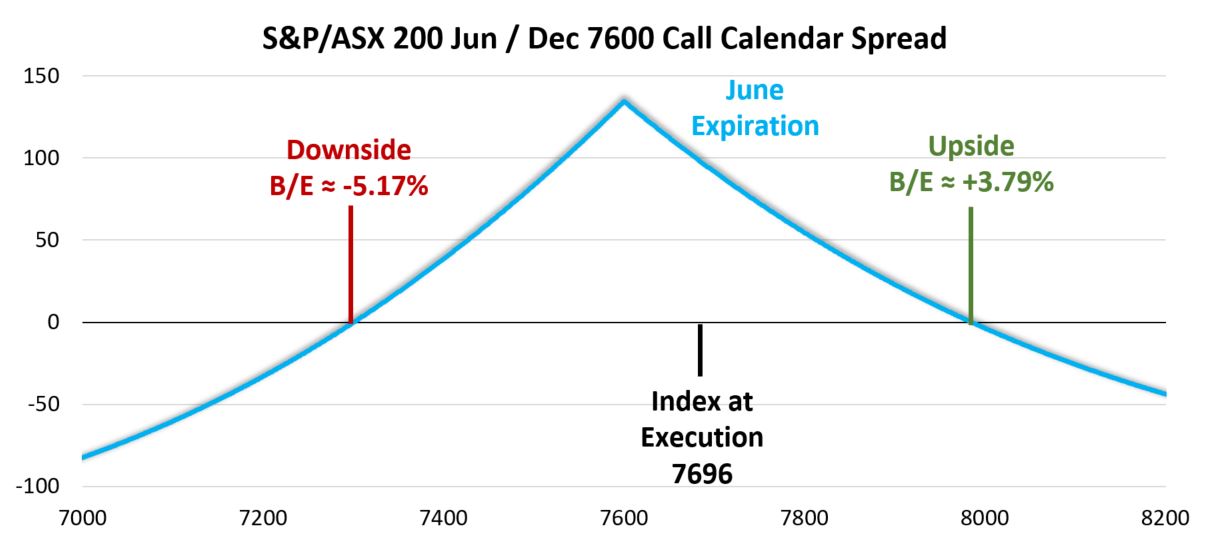
On 2 February, with the S&P/ASX 200 at 7696 a trader sold 500 Jun 7600 Calls for 276.00 and purchased 500 Dec 7600 Calls for 422.00 and a net cost of 146.00 per calendar spread. We are going to share multiple payoff diagrams related to this trade as we consider the different goals behind this trade as well as possible next steps after June expiration. The first payoff diagram is based on pricing at June expiration.
Data source: Bloomberg
The best-case scenario at June expiration occurs if the S&P/ASX 200 is right at the strike price of 7600. In this situation the long Dec 7600 Call leg, that is still open, is valued at about 276.00, which combined with the original cost of 142.00 results in an unrealized gain of about 134.00. The downside break-even is just under 7300 or down 5.17% and the upside break-even is 3.79% higher. All these figures assume the December leg is closed out at June expiration. However, we decided to look at some alternative outcomes based on holding the long Dec 7600 Call leg of the trade.
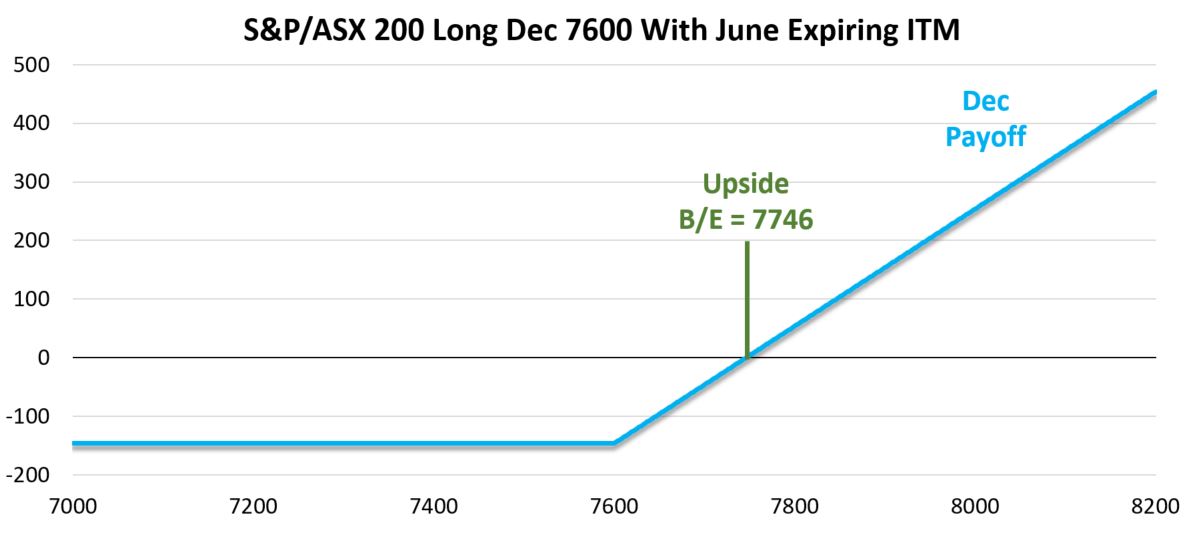
First, we consider the payoff at December expiration if the trade is held through that date and no other short positions are initiated after June expiration. If the December leg expires worthless, which occurs if the index is at or below 7600 at June expiration, then the payoff will look like the diagram below.
Data source: Bloomberg
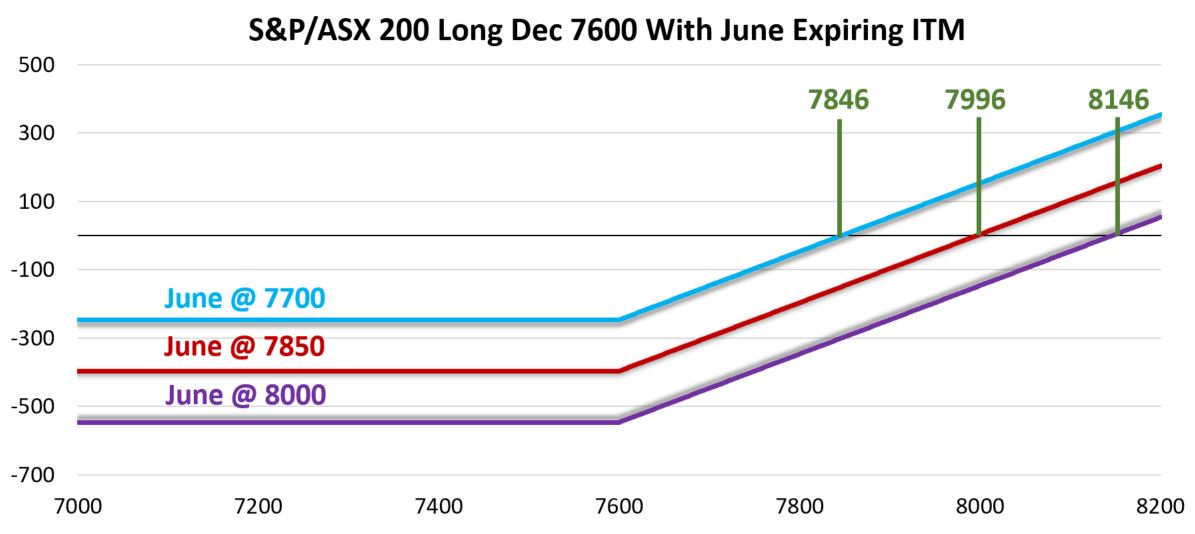
Recall the cost of the Dec 7600 Call was 422.00, if the June call is out of the money at expiration, we can think of the cost of the long call as being the original 146.00 for the calendar spread. Since there is no way of knowing where the index will be on 20 June, we changed the break-even level from a per cent to the index level. The break-even level is only 50 points higher than where the index was when the calendar spread was executed. Again, for this payoff the S&P/ASX 200 needs to be at 7600 or lower. What if the index is in the money at expiration? The next payoff diagram assumes settlement levels of 7700, 7850, and 8000 at June expiration.
Data source: Bloomberg
The three index prices levels are arbitrary, but also realistic as they represent moderate upside from where the S&P/ASX 200 was quoted when the original calendar spread was executed. One method of thinking about this is adding the loss on the short 7600 call to the cost of the trade. For example, if June settlement is 7850, the loss on the short leg is 250.00. Adding 250.00 to the original cost of 146.00 results in a ‘cost’ of 396.00 for the long call, which places the break-even at 7996.
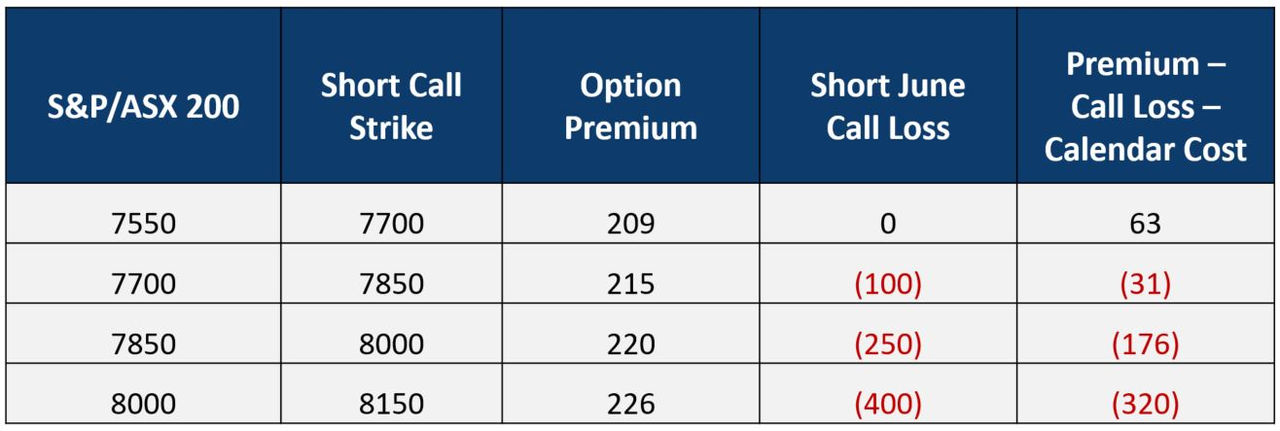
It is common for a calendar spread trader to sell another option against the long leg of a calendar spread when the short leg expires. We are going to make two assumptions with respect to the next step for this calendar spread. First, we are going to consider selling a December Call with a higher strike price than the long Dec 7600 Call. There are many moving parts and assumptions that go into this analysis. For illustration purposes, we will assume four levels at June expiration (7550, 7700, 7850, and 8000). The latter three levels are a repeat of the ITM examples in the previous diagram, while 7550 is added to represent a result where the short June call expires with no value. The table below shows the estimated price of December call options based on the four index levels and adding 150 points to each of those levels. Then the original calendar spread cost (146.00) is summed with the June call result and the premium taken in by selling the relevant call option.
Data source: Bloomberg
Again, these levels are arbitrary and for illustration purposes, but this is a good demonstration of how a trader may approach an outlook that is neutral for the near term and long term bullish. The result, if everything goes to plan and the index is slightly under 7600, is a bull call spread initiated at a net credit. However, situations that realize a loss on the short June call have favourable outcomes as well. The payoff diagram below highlights the result at December expiration for each spread.
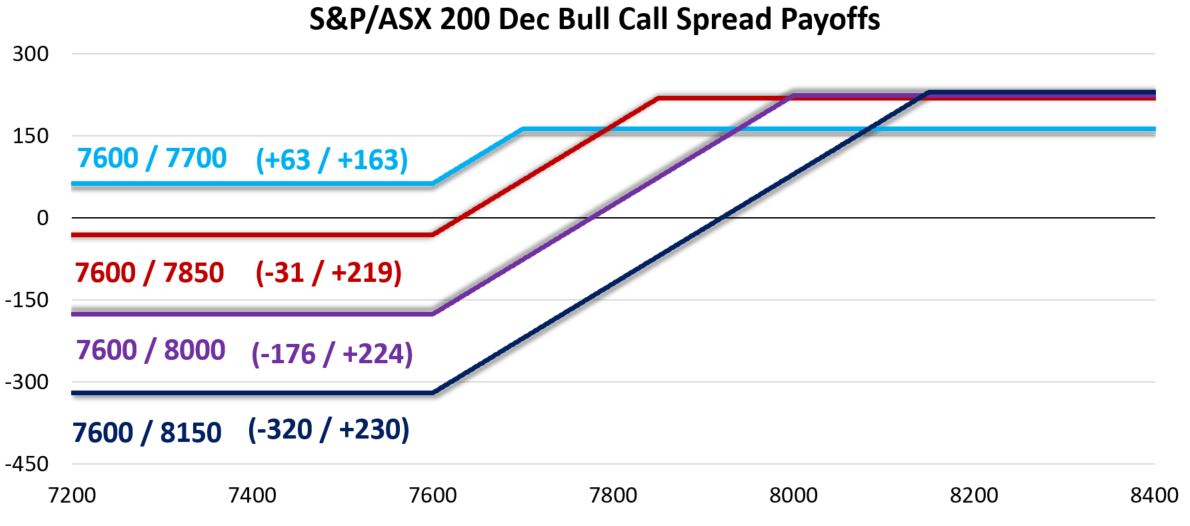
Data source: Bloomberg
Each of the four potential payouts above list the long strike (7600 for all) and the short December call strike. To the right of each label is the potential payout at expiration for each bull call spread constructed using premiums taken in from selling the June 7600 Call and December call options. In all cases, if the index is unchanged over the six months between June and December expiration the trade would realize a profit.
These examples of the second step in this calendar spread are just a couple of an unlimited number of alternatives. For example, the trader may consider selling options that expire before December and repeating the process on that expiration date. They also may hold the December call and hope for a better opportunity to execute the second short leg of this trade. We put these two options on our quote screen and plan on trying to pick up on any managing trades or a second sale when June expiration rolls around.
Other Insights
This is the second article in a series of trading activity observations in 2024. To receive these insights via email, please subscribe to the ASX Equity Derivatives monthly newsletter.

Option trading strategies for bears, bulls and butterflies
5 February 2024
About the author
Disclaimer
The views, opinions or recommendations of the author in this article are solely those of the author and do not in any way reflect the views, opinions, recommendations, of ASX Limited ABN 98 008 624 691 and its related bodies corporate (“ASX”). ASX makes no representation or warranty with respect to the accuracy, completeness or currency of the content. The content is for educational purposes only. Examples used are intended to detail the performance of historic trading strategies. Past performance is not a reliable indicator of future performance. The content does not constitute financial advice. Independent advice should be obtained from an Australian financial services licensee before making investment decisions. To the extent permitted by law, ASX excludes all liability for any loss or damage arising in any way including by way of negligence. © Copyright ASX Operations Pty Limited ABN 42 004 523 782. All rights reserved 2024.
ASX acknowledges the Traditional Owners of Country throughout Australia. We pay our respects to Elders past and present.
Artwork by: Lee Anne Hall, My Country, My People
