With government bond yields at record lows and in many cases delivering negative real yields (after inflation), investors have had to look to additional asset classes to meet their income needs. A popular income solution for many is global listed infrastructure.
The asset class has a long-term record of consistently delivering attractive yields and offers a growing income stream linked to the asset base of the companies rather than the business cycle. It also provides portfolio diversification benefits, such as a lower correlation (relationship) to equities.
By investing in infrastructure, one invests in the companies that own and operate the physical assets that provide many essential services to society. These are services we use and interact with every single day. For instance, we use gas, water, and electricity to carry out our daily activities.
We also use transportation infrastructure, such as rail and roads, to get around and communication infrastructure, such as cellular towers, to connect with each other.
Understanding infrastructure
Broadly, infrastructure can be categorised into two key buckets:
- regulated assets
- user-pays assets
With regulated assets, such as water, electricity and gas transmission and distribution, the regulator determines the revenues that a company should earn on their assets. If an asset earns too much, the company is required to return some of its revenues to its customers by lowering prices.
Conversely, if the asset earns too little, the company is allowed to increase its prices. Because demand for these assets is steady and the regulator determines revenue, companies owning and operating regulated assets show a relatively stable cash flow profile over time.
Additionally, the regulator periodically accounts for inflation and bond yields, which means price increases are often linked to inflation, and long-term valuations are relatively immune to changes in bond yields.
With user-pays assets, pricing is generally set by contracts, where volume and revenue is determined by how many people use the assets. User-pays assets are usually physical assets, such as rail, airports, roads and telecommunications towers, which move people, goods and services throughout an economy.
As an economy grows, develops and prospers, demand for these assets also typically grows. For instance, as more people use, and to some degree, depend on mobile phone data, we see mobile communications operators adding additional capacity to the physical towers to meet this demand.
Infrastructure investing and yield
Infrastructure companies can, therefore, potentially provide predictable income distributions due to stable earnings derived from underlying assets. For investors, this can offer better visibility for revenues and dividends.
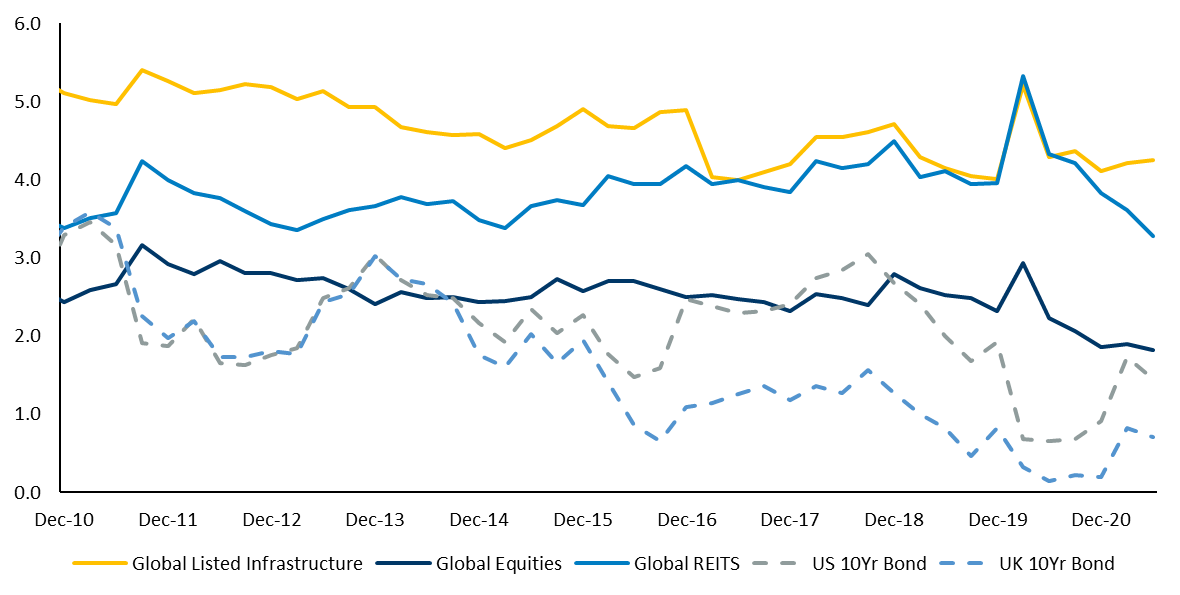
Chart 1 below illustrates that global infrastructure has delivered to investors a higher yield than global equities and global bonds - and, over most time frames, a yield greater than global listed property.
Chart 1: The dividend yield of Infrastructure is at a premium to most asset classes

Source: ClearBridge Investments * As at 30 June 2021. *Global Listed Infrastructure: ClearBridge Investments Income Universe, monthly since June 2010. Global Equities: MSCI World Forward Dividend Yield, MXWO Bloomberg, Global REITS: FTSE EPRA/NAREIT Forward Dividend Yield - FENHG Index, Bloomberg, US Benchmark Bond 10 year – Yield, Factset Research Systems, United Kingdom Benchmark Bond 10 Year - Yield, Factset Research Systems. Opinions expressed are subject to change without notice and do not take into account the particular investment objectives, financial situations or needs of investors. Past performance is not indicative of future performance.
Infrastructure versus listed property
In this current environment, investors have had to look beyond traditional sources of income. Although global equities and Australian Real Estate Investment Trusts (A-REITs) can provide attractive yields relative to bonds, both have revenues and, ultimately, dividends closely linked to economic activity.
In ClearBridge’s view, infrastructure has an edge as a long-term income solution, as revenues are generally linked to the asset base of infrastructure companies.
As a result, it is necessary to understand the quality of an infrastructure company’s assets and a detailed assessment of the regulation or contracts governing them. This is what delivers stable cash flows and greater capital stability.
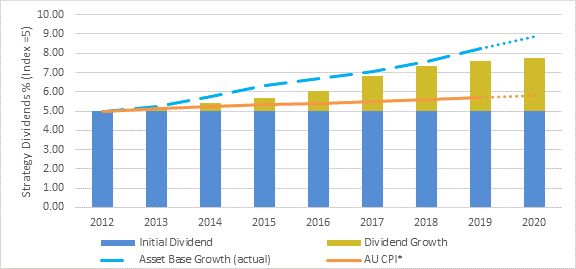
As demonstrated in Chart 2 below, dividend growth for infrastructure companies has closely tracked the growth in the asset base of infrastructure companies.
Chart 2: Infrastructure dividends linked to a growing asset base

Source: ClearBridge calculations as at 30 June 2021. ClearBridge Infrastructure Income Strategy. Past performance is not indicative of future performance.
Portfolio infrastructure allocations
Many investors believe that they already have exposure to infrastructure as a part of their traditional global equity portfolio. Although this is true to an extent, a global equities portfolio will generally only provide a small exposure to a handful of large-cap utility companies.
A dedicated listed infrastructure allocation provides not only reliable and growing income, but also diversification across infrastructure sub-industries as well as political and regulatory regimes, where risks differ. It also offers the ability to invest across the market cap spectrum where specialist sector knowledge can be applied.
In addition to attractive income, infrastructure can also strengthen overall portfolio outcomes.
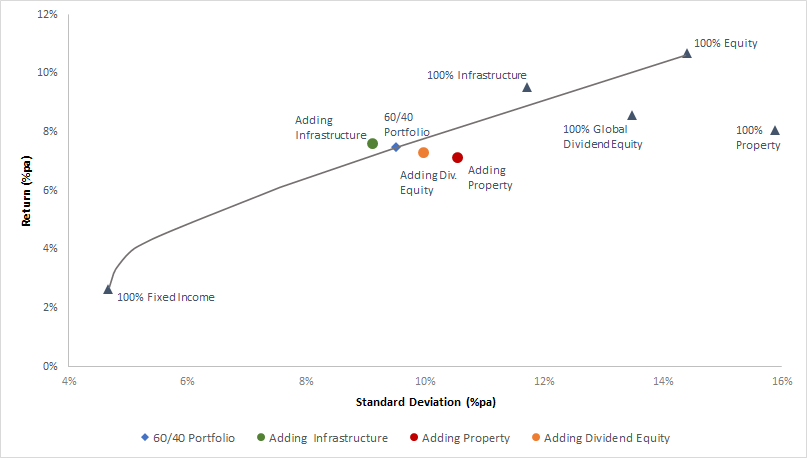
To illustrate this point, below is an efficient frontier created by different combinations of global equity and global fixed income since January 2010, with a traditional 60% equities and 40% bonds mix, marked with the blue diamond in Chart 3.
Chart 3: Efficient Frontier

Source: ClearBridge, eVestment. Monthly returns in USD for the period 1 January 2010 to 30 June 2021. Portfolio rebalanced annually. Indices used; Global Bonds: Bloomberg Global Aggregate; Global Equity: MSCI ACWI; Dividend Equity: MSCI ACWI High Dividend; Global Infrastructure: FTSE Global Core Infrastructure 50/50; Global Property: FTSE EPRA NAREIT Global. Past performance is not indicative of future performance. For illustrative purposes only and does not constitute specific investment advice or recommendations on any particular securities or asset classes.
Including an allocation to listed infrastructure would shift the efficient frontier. An equally weighted portfolio of listed infrastructure, global equities and fixed income (shown in green dot in chart above) increased returns while reducing portfolio volatility.
Conversely, adding listed property (red dot in chart above) or dividend equity (orange) with the same weights negatively impacted portfolio efficiency.
Long-term infrastructure demand
Furthermore, infrastructure is in a multi-decade secular growth cycle where the assets will play a pivotal role in the path to net-zero emissions. Trillions of investment dollars need to be made over the coming decades, which will underpin the allowed returns, and ultimately dividends.
In ClearBridge’s view, this will likely drive the asset base growth of these companies and potentially provide a tailwind for infrastructure investors seeking income and the potential for capital appreciation.
Specialist listed infrastructure managers have a sustainable competitive advantage as their focus on long-term outcomes and appropriate returns for the capital providers is aligned with the long-term nature of regulation and contractual structures.
Investors who seek to improve the risk versus return outcomes of their traditional equity and bond portfolio while receiving stable and growing income in a secular growth environment should question the proportion of their portfolio they have allocated to global listed infrastructure strategies.
More Investor Update articles
The views, opinions or recommendations of the author in this article are solely those of the author and do not in any way reflect the views, opinions, recommendations, of ASX Limited ABN 98 008 624 691 and its related bodies corporate (“ASX”). ASX makes no representation or warranty with respect to the accuracy, completeness or currency of the content. The content is for educational purposes only and does not constitute financial advice. Independent advice should be obtained from an Australian financial services licensee before making investment decisions. To the extent permitted by law, ASX excludes all liability for any loss or damage arising in any way including by way of negligence.

