
Index innovation on ASX adds to changing investment landscape
- Fri 03 September 2021
In the fifth story of a series that commemorates the Australian Securities Exchange’s 150th anniversary in 2021, ASX presents a modern history of indices on the exchange.
Most investors are familiar with sharemarket indices through radio or TV reports. Perhaps you’ve heard the “ASX 200” or “All Ords” mentioned in a stock report.
These descriptions refer to the S&P/ASX 200 index and the All Ordinaries index. The ASX 200 measures the performance of the 200 largest index-eligible stocks on ASX by market capitalisation. The All Ords represents the 500 largest stocks on ASX.
Investors use these and other indices to understand how the Australian sharemarket has performed over short and long periods. But there’s much more to indices than market ups and downs.
In fact, the development of indices over shares and fixed interest is one of the great trends in ASX’s modern history. Indices help investors construct portfolios, diversify investments, measure and benchmark returns, identify opportunities and gauge investor sentiment.
Growth in ASX indices has been accompanied by the boom in Exchange Traded Funds (ETFs) in Australia and overseas. ETFs are often index funds, and they’re changing how people invest.
Over a century of index history
To recap, ASX Investor Update is presenting a series of essays this year to commemorate ASX’s 150th anniversary. We’ve chosen October 1998 as the start of ASX’s modern history because that is when ASX became the first exchange to demutualise and list directly on its own market.
Previous stories in this series have examined the evolution of fixed-interest investing on ASX; how ASX-listed funds are transforming investment products; the changing face of Australian share ownership; and Why Australia is one of the world’s great IPO markets.
Sharemarket indices on ASX go much further back than 1998. Records[1] from the then Sydney Stock Exchange[2] for the All Ordinary Share Price index[3] show index figures were available continuously each month from 1936, and daily from 1958[4].
In fact, the Sydney Stock Exchange had a commercial and industrial index comparable with the All Ordinary index from 1875 to 1957. Before 1958, there were share price indices calculated by stock exchanges, newspapers, banks, share brokers, and government departments.
The first version of the All Ords had 34 stocks[5] and contained “groups” such as alcohol, food, and tobacco; pastoral; textiles and clothing; and electrical and durables[6].
On 1 January 1980, a new series of share-price indices, produced jointly by the stock exchanges of Sydney and Melbourne, appeared[7]. The indices were initially based on Sydney and Melbourne share prices but could incorporate price data from other state exchanges.
S&P/ASX indices series
ASX managed a range of share-price indices internally until 2000 when Standard & Poor’s assumed that role. S&P Dow Jones Indices launched the S&P/ASX index series that year[8].
No index development was more important than the introduction of the S&P/ASX 200 index in April 2000. The ASX 200 – one of the world’s pre-eminent sharmarket indices – celebrated its 20th anniversary last year, just after the Covid-related sell-off in global equities.
The ASX 200 had a starting value of 3,331 points on 3 April 2000[9]. The index was 7,489 points in August 2021[10], which again reinforces the power of long-term investing. Returns are higher when dividends are included (as a price index, the ASX 200 does not include the dividend component of the total return). ASX launched another key index – the ASX SPI 200 Index Futures and Options – in 2000.
In 2001, the Global Industry Classification Standard (GICS) was introduced for the Australian sharemarket[11]. GICS was developed jointly by S&P and MSCI – two leading global index providers – as a global standard to categorise companies into sectors and industries[12].
The GICS classification system currently has 11 sectors[13], 24 industry groups, 69 industries, and 158 sub-industries. Through GICS, investors can compare the performance of Australian sectors to those in the United States or Europe, for example.
Also in 2001, the S&P/ASX Index series saw the first ETFs quoted on ASX when State Street Global Advisors launched ETFs over the ASX 200 and S&P/ASX 50 indices.
Other key indices launched over the past two decades include:
- 2004: the S&P/ASX Buy-Write index, which replicates a well-known options trading strategy[14].
- 2006: the S&P/ASX All Ordinaries Gold index.
- 2010: the S&P/ASX VIX index (A-VIX)– a real-time index that reflects investor sentiment regarding the expected volatility of the ASX 200[15].
- 2011: the S&P/ASX Australian Fixed Interest indices – a broad benchmark index family designed to measure the performance of the Australian bond market.
- 2019: the S&P/ASX 200 ESG index, which measures the performance of securities that meet sustainability criteria.
- 2020: the S&P/ASX All Technology index, which includes 79 technology-oriented companies on ASX[16].


The S&P/ ASX All Technology index is an example of the benefits of index innovation for investors. In a single trade (through the BetaShares S&P/ASX Australian Technology ETF – ASX: ATEC), investors can gain diversified exposure to the fastest-growing sector on ASX[17].
These and other innovations have led to dozens of real-time indices on ASX: The main index categories are:
- Capitalisation indices that include companies according to their market capitalisation.
- Sector indices that benchmark the performance of a market sector of industry.
- Strategy indices that reflect the performance of rules-based strategies.
- Volatility indices that provide a measure of investor sentiment.
- Accumulation indices that assume all dividends are reinvested, so measure both capital growth and dividend income. These indices are particularly important in Australia, which has a history of relatively attractive dividends by global standards.
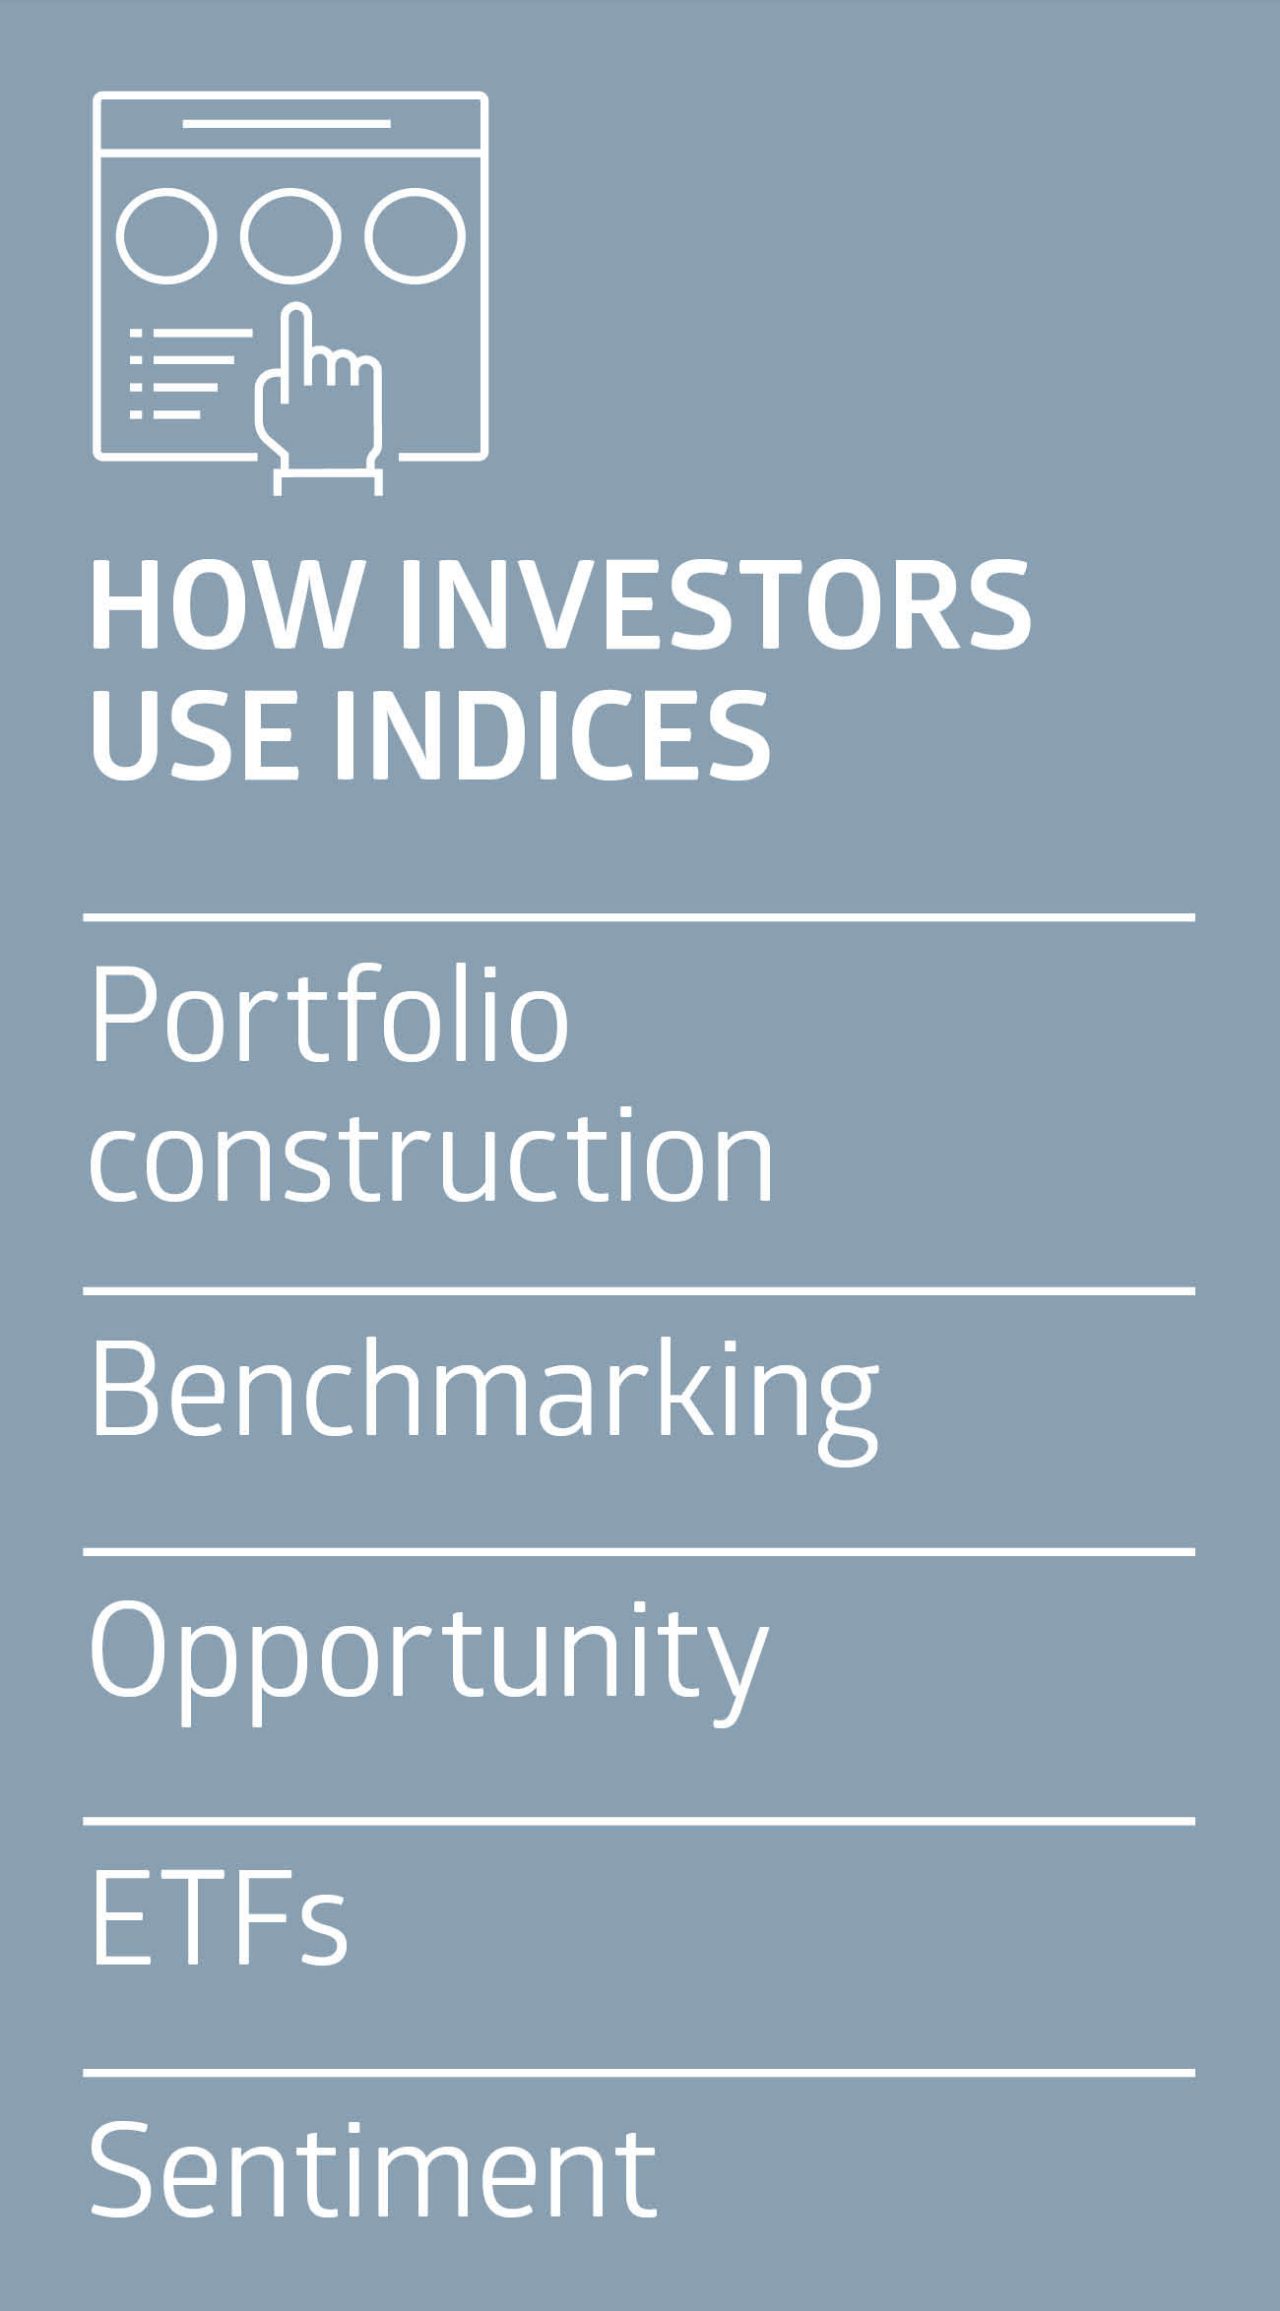
How investors use indices
Indices might seem esoteric to some investors, or have little use beyond showing the sharemarket’s performance. But indices are at the heart of long-term investing and trading.
Here are five ways investors use indices.
1. Portfolio construction
Indices provide insight into asset classes or segments within them. For example, the S&P/ASX 200 index has a 29.3% weighting in Financial stocks and a 21.5% weighting in Materials[18]. This means half of the ASX 200 is based mostly on the performance of banks and resource stocks.
The Commonwealth Bank is the largest stock in the S&P/ASX 200, followed by BHP Group, CSL, Westpac, National Australia Bank, and ANZ[19].
Understanding how an index is constructed[20] can help investors allocate assets in their portfolios. For example, investors who own an ETF over the S&P/ASX 200 index might believe they have enough exposure to Financials, so do not hold bank stocks directly.
Other investors who favour tech stocks might invest in an ETF over the S&P/ASX All Technology index to increase their portfolio exposure to that sector.
2. Benchmarking
Indices allow investors to compare their portfolio to a benchmark index.
Consider an investor who owns Australia’s four largest banks – Commonwealth Bank (ASX: CBA), Westpac (ASX: WBC), National Australia Bank (ASX: NAB) and ANZ (ASX: ANZ).
After share-price gains this year, these stocks now comprise half the value of the investor’s portfolio. The investor compares that to the S&P/ASX 200 index, where Financials have a 29.3% weighting and decides her portfolio is too exposed to banks and lacks diversification.
Another investor is happy with a portfolio return of 20% over one year, until comparing it to the S&P/ASX 200 index’s 30.3% total return over one year to end-July 2021[21]. The investor would have been better off investing in a low-cost ETF that replicates the ASX 200 return.
Institutional investors use indices in other ways. A fund manager that invests in Australian shares might benchmark its performance against the S&P/ASX 200 Accumulation index.

The fund will take overweight, underweight and market-weight positions on stocks or sectors in that index. For example, the fund might have a bullish view on Australian resource stocks. So, instead of holding a 21.5% weighting in Materials (like the S&P/ASX 200 index currently has), the fund takes an “overweight” 30% position, to enhance returns.
Within that, the fund might have overweight positions in BHP Group (ASX: BHP), Rio Tinto (ASX: RIO) and Fortescue Metals Group (ASX: FMG), compared to their weightings in the S&P/ASX 200, because it likes the long-term outlook for iron-ore prices.
3. Opportunity
Some investors use market and sector indices to identify opportunities. For example, an investor might compare the performance of the S&P 500 index in the United States to the S&P/ASX 200 index in Australia over 10 years. The investor finds the S&P 500 has outperformed over that period and believes it is time to increase exposure to Australian shares.
Another investor compares the S&P/ASX 300 index to a sector, such as energy. The investor notes the S&P/ASX 300 Energy index has underperformed the S&P/ASX 300 for the past decade, and that the gap between the two indices has widened. The investor believes there could be a contrarian buying opportunity in the energy sector, so does more research[22].
Meanwhile, an active investor uses indices to capitalise on short-term market volatility. When global equities tumbled in March 2020 because of Covid uncertainty, the investor believed technology would be the first sector to recover, as it was after the 2003 SARS pandemic.
The investor bought an ETF over the S&P/ASX All Technology index and another ASX-quoted ETF over the Nasdaq 100 index, to gain exposure to local and global tech stocks via ASX.
Some professional investors closely follow quarterly index rebalancing, when new stocks are added to an index and others are excluded. They believe the share price of new index constituents might rise as they attract new buying from index funds, and vice versa.
Whatever your investment strategy, it’s a good idea to follow index movements to get a sense of which markets and sectors are outperforming or underperforming.
4. Exchange Traded Funds
No essay on ASX indices is complete without a section on Exchange Traded Funds. ETFs aim to match the price and yield return of an underlying index. For example, an ETF over the ASX 200 index should provide a similar total return to that index.
ETFs are the fastest-growing investment-product category on ASX and a global investment phenomenon. The combined market capitalisation of ETFs on ASX rose 74.1% to $116.5 billion over the year to end-July 2021[23]. There are now 223 ETFs on ASX.
By asset class, there are ETFs over Australian shares, global shares, fixed income, property, commodities, currencies, and cash. It’s possible to construct a portfolio across asset classes entirely with ASX ETFs, and then rebalance that portfolio, perhaps quarterly or annually.
By ETF styles, there are index-tracking ETFs, such as those over the ASX 200. There are also smart-beta ETFs that use investment rules based on certain factors. For example, an ETF over an index that has been constructed to include companies with a history of higher dividends.
By contrast, active ETFs – a fast-growing category of ETFs on ASX – are actively managed funds that benchmark their performance against an index.
Some investors use ETFs to construct a long-term portfolio because they have lower fees than most comparable active funds, and are bought and sold on ASX-like shares, making them transparent, convenient and simple to use.
Also, S&P research[24] shows about 80% of active funds managers underperformed the S&P/ASX 200 index over 10 years, reinforcing the case for index funds.
Active investors also use ETFs to “tilt” portfolios and time markets. A trader might believe Australian shares will rally after a correction, so buys an ETF over the ASX 200 index. Another believes our sharemarket will fall, so buys an ETF that rises when our market falls.
5. Sentiment
Indices also provide useful clues on investor sentiment. The S&P/ASX VIX index measures the 30-day implied volatility of the Australian sharemarket using the settlement prices of S&P/ASX 200 put and call options.
Volatility indices are closely followed overseas. The Chicago Board of Options Exchange’s VIX index has been called the “fear and greed” index, based on its tracking of investor sentiment.
Some investors buy stocks when the VIX is high and sell when it is low. A high VIX reading signals high implied market volatility and is usually accompanied by market fear.
No investment rule is infallible, but buying when market fear is high can be a profitable strategy. So, too, can selling when implied volatility is low and investors are more interested in greed than fear. There’s an old investment saying: “When the VIX is high, it’s time to buy; when the VIX is low, look about below.”
Index futures are another sentiment gauge. Those such as the ASX SPI 200 Futures can provide a pointer to whether the Australian sharemarket will open up or down, and by how much. Unlike the ASX equities market, which trades from 10am to 4pm, futures trade through the night and reflect offshore market moves.
No index future is foolproof, and the signal sometimes only works briefly, or not at all, on a particular day. But most traders watch what the ASX SPI 200 says for the day ahead.
The Future
Indices on ASX have come a long way during ASX’s modern history – and even further compared to the days when data on the All Ords was published monthly. But there is plenty of innovation ahead as indices evolve to reflect changing investor needs.
Recent growth in Environmental, Social and Governance (ESG) indices on ASX is an important trend. As more investors look to allocate their capital to companies that help rather than harm the planet, they will need indices that factor ESG criteria into stock selection.
Several ESG-related ETFs on ASX have been launched in the past few years, providing investors with exposure to local and global companies that rate higher on sustainability rankings.
It’s now possible to compare the ESG carbon characteristics of the S&P/ASX 200 index to other global markets. Or compare the carbon intensity of sectors.
Over time, it’s possible that retail investors could use portfolio services that measure the total carbon emissions of listed companies they own and compare that to a benchmark index.
ESG-focused investors will want their portfolio to have fewer carbon emissions than the average in the S&P/ASX 200 – while still providing an attractive financial and social return.
Index issuers continue to launch ESG-related indices here and overseas, but this could just be the start as investors increasingly seek non-financial information on issues, such as carbon emissions, to factor into their investment strategy.
And more ways to invest in ESG leaders – and avoid ESG laggards – through indices.
About the author
References and notes
[1] The Sydney Stock Exchange All Ordinary Share Price index. May 1976.
[2] The Australian Stock Exchange was formed on 1 April 1987 through the amalgamation of six independent stock exchanges in the states’ capital cities, including the Sydney Stock Exchange.
[3] As the index was known then.
[4] The Sydney Stock Exchange had a commercial and industrial index comparable with the All Ordinary index from 1875 to 1957. Before 1958, there were a number of share-price indices calculated by stock exchanges, banks, newspapers, share brokers and government departments in Australia.
[5] ibid
[6] ibid
[7] The Australian Stock Exchange Indices
[8] S&P. Feb 2020 “S&P/ASX Indices: a Chronology.”.
[9] ASX, “S&P/ASX Index has its 20th anniversary,”. 3 April 2020.
[10] August 23, 2021
[11] ibid
[12] S&P Dow Jones Indices, September 2019, “Global Industry Classification System (GICS) Methodology,”.
[13] As well as the 11 GICS sectors, the ASX and S&P have developed six additional sector indices to reflect the characteristics of the Australian sharemarket.
[14] The S&P/ASX Buy-Write index replicates the performance of a well-known options trading strategy where an investor holds a long position in a security and then writes (or sells) call options against the long position.
[15] S&P, July 2021. “S&P.ASX 200 VIX index,” Factsheet.
[16] At July 30, 2021.
[17] By company listings
[18] Standard & Poors, July 2021. S&P / ASX 200 Factsheet.
[19] ibid
[20] S&P factsheets on S&P indices – available at www.spglobal.com – are a great source of information on index methodology and construction.
[21] Standard & Poors, July 2021. S&P / ASX 200 Factsheet.
[22] Do not read that as a sector recommendation. Do further research of your own or talk to a licensed financial adviser before acting on themes in this article.
[23] ASX, July 2021. “ASX Investment Products Report.”
[24] S&P. SPIVA data by region. Australia. Aug 2021. Over 10 years to Dec 31, 2020.
More Investor Update articles
The views, opinions or recommendations of the author in this article are solely those of the author and do not in any way reflect the views, opinions, recommendations, of ASX Limited ABN 98 008 624 691 and its related bodies corporate (“ASX”). ASX makes no representation or warranty with respect to the accuracy, completeness or currency of the content. The content is for educational purposes only and does not constitute financial advice. Independent advice should be obtained from an Australian financial services licensee before making investment decisions. To the extent permitted by law, ASX excludes all liability for any loss or damage arising in any way including by way of negligence.
