
Why Australia is one of the world’s great IPO markets
- Fri 07 May 2021
In the first story of the series that commemorates the Australian Securities Exchange’s 150th anniversary in 2021, ASX presents a modern history of the Initial Public Offerings (IPO) market.
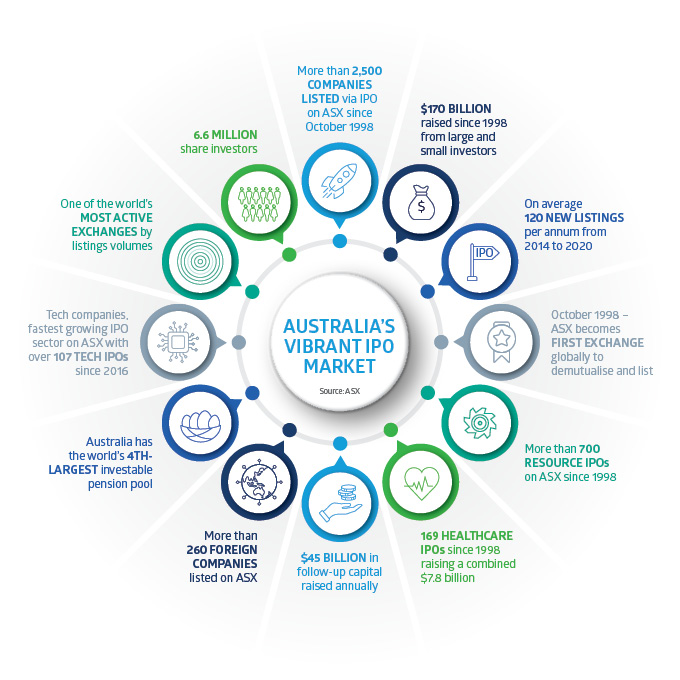
Initial Public Offerings have been integral to Australia becoming a nation of 6.6 million share investors[i]. Many people bought shares for the first time through the privatisations of Telstra Corporation[ii] (TLS), Commonwealth Bank of Australia (CBA), and Qantas Airways (QAN) in the 1990s.
Other well-known companies, such as JB Hi-Fi (JBH), Domino’s Pizza Enterprises (DMP), and Afterpay (APT), listed on ASX through IPOs this century. So, too, did Seek (SEK), Carsales.com (CAR), and Medibank Private (MPL). These companies are worth much more today than they were at their IPO.
There have also been IPO disappointments over the years. That is the nature of investing in new listings. ASX attracts many IPOs each year from diverse industries. Some are well-established, billion-dollar companies; others are early-stage ventures.
Diversity is a strength of IPOs on ASX. New listings range from small miners that raise capital to fund exploration; to lifescience companies researching cures for disease; to tech companies developing software; to large industrial companies raising capital to expand overseas … and much more in between.
More than 2,500 companies have listed on ASX through an IPO since October 1998.[iv] Together, these companies raised about $170 billion from large and small investors.[v]
October 1998[vi] is the starting point for this essay because that was when the Australian Securities Exchange[vii] became the world’s first exchange to demutualise and list directly on its own exchange. From there, ASX’s “modern history” began.
Today, ASX is one of the world’s most active exchanges by listings volumes.
ASX has over 120 new listings each year.[viii] On average, these companies raised a combined $10 billion through their IPOs.[ix] Another $45 billion of follow-up capital – vital to help newly listed companies keep growing – is raised on ASX annually.[x]
ASX is attractive for IPOs because Australia has the world’s fourth-largest investable pension pool.[xi] Our superannuation sector is projected to be worth $10 trillion in 2038, from $2.7 trillion in 2020.[xii] Potentially, that means a lot more capital available to invest in new listings.
Source: ASX
Benefits of IPOs
The IPO market on ASX does more than connect companies and capital. For investors, IPOs can be a window to some of Australia’s most exciting companies.
Buying stock in a company at a fixed price before it lists on an exchange can be financially rewarding. It can also be personally rewarding for investors who identify a high-potential company at IPO, buy its shares and watch it grow over many years.
Companies typically use IPOs to raise capital, invest and grow. An IPO can also attract new shareholders, lift the company’s profile and provide further opportunities to raise capital after listing.
Often, an IPO is a proud “milestone” in a company’s journey. Perhaps you’ve seen a CEO of an IPO ring a celebratory bell at an exchange when shares in the company start trading.
As such, the IPO market has an important role in Australia’s capital-raising ecosystem, and in the economy. Over many years, IPOs on ASX have been a mechanism for local and international companies to expand their business and build wealth for shareholders and the community. Many of Australia’s great companies today once had an IPO on ASX.
Moreover, being listed on ASX requires compliance with ASX Listing Rules and the adoption of corporate governance principles.[xiii] There are higher requirements and expectations around financial reporting for listed companies, and on Environmental, Social and Governance (ESG) performance.
In one way or another, all Australians benefit from a vibrant local IPO market. Listed companies provide jobs for millions of people, produce products and services used every day, and create opportunities for investors to benefit from a company’s success.
Investors have much to look forward to with IPOs on ASX. More tech IPOs, more United States, New Zealand, and other offshore companies listing on ASX, greater integration of the ASX IPO market in the Asian region … these are just a few themes in the next chapter of the “modern history” of IPOs on ASX.
Here are seven IPO themes:
1. Rise of technology IPOs
The first wave of tech IPOs on ASX was in the late 1990s as a rush of internet-related companies listed. Growth in the adoption and use of the internet encouraged speculation in tech stocks. When the “dot-com bubble” burst in March 2000, many tech companies worldwide failed.
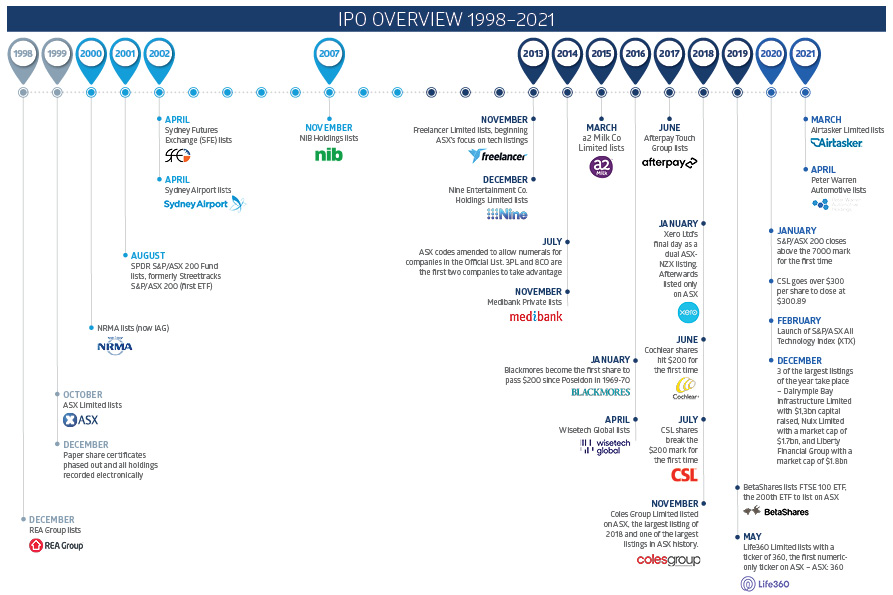
By 2005, a new breed of tech-enabled companies started to list on ASX. Seek (SEK), a publisher of online job ads, listed in April that year. IPOs of Wotif.com Holdings (2006), Carsales.com (CAR)(2009), and Trade Me Group (2011) added to the growing tech exposure on ASX.
The next wave of tech listings on ASX started in November 2012 with the dual listing of Xero (XRO), an accounting software provider (Xero was listed on the NZX in New Zealand at the time of its ASX listing). In early 2018, Xero transitioned to a sole listing on ASX.
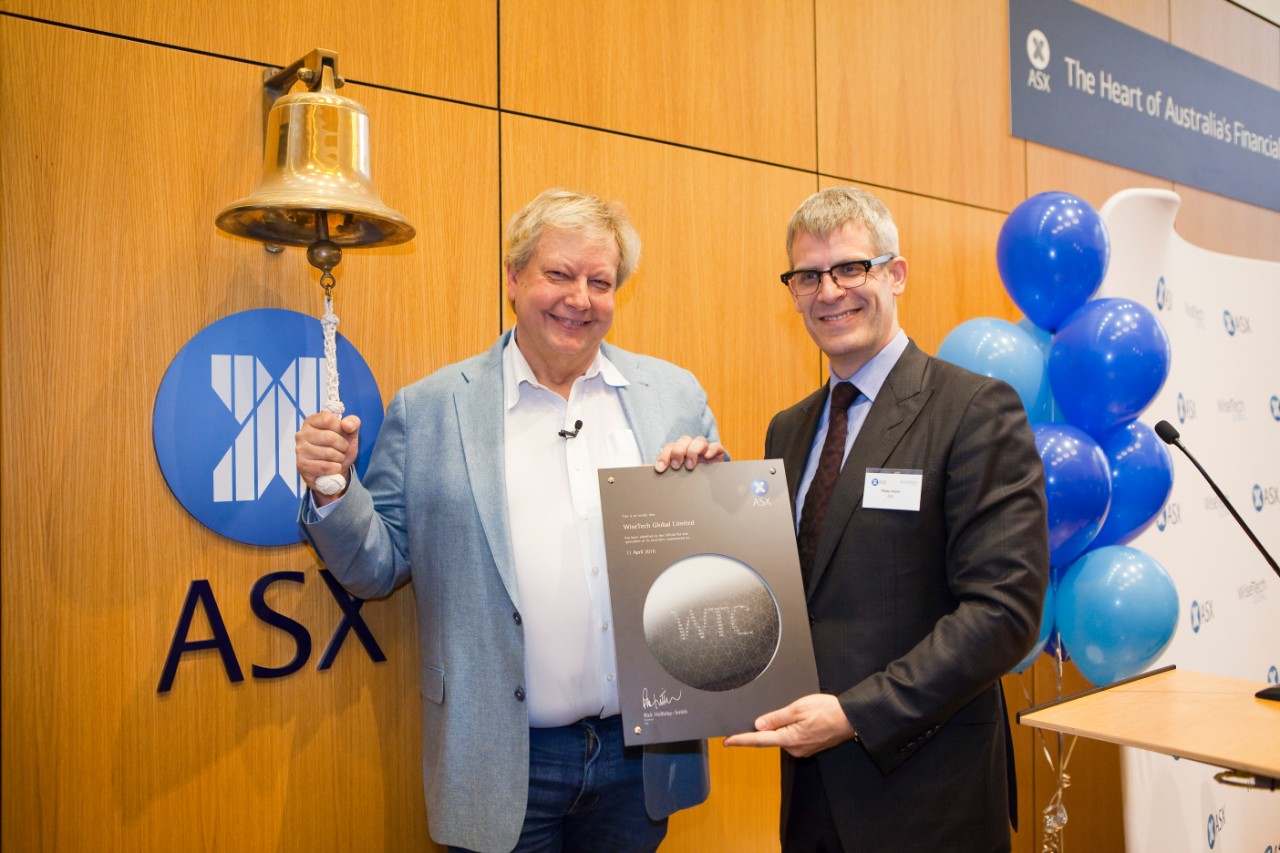
The Xero listing in 2012 was followed by IPOs of Appen (APX) (2015) and WiseTech Global (WTC) (2016). In 2016, five of the top 10 IPOs were financial technology (fintech) companies. They included Afterpay (APT), Pushpay Holdings (PPH), and Bravura Solutions (BVS). Recent tech IPOs include Nuix (NXL) and Tyro Payments (TYR).
These and other IPOs have contributed to a strong period of growth in tech listings. ASX had 107 tech IPOs over FY2016-20, behind only the Japan Exchange Group and NASDAQ by volume.[xiv]
Tech is now the fast-growing sector on ASX, and the top sector by number of IPOs.[xv] More than 30 tech “unicorns” (companies valued at more than $1 billion) are listed on ASX.[xvi] They are led by the ‘WAAAX stocks’ – WiseTech Global (WTC), Afterpay (APT), Altium (ALU), Appen (APX), and Xero (XRO).
Generally, tech companies are more developed when they list on ASX. A few years ago, an average tech IPO raised $10-$15 million and had a $100-million valuation. Today, they are likelier to raise $100 million and be valued at $500-$600 million upon listing.
Tech listings are important for investors. They provide exposure to companies operating in potentially higher-growth sectors in global markets. Tech listings also increase choice for investors as the tech sector’s weighting in the S&P/ASX 200 index slowly increases.
The creation of the S&P/ASX All Technology Index (XTX) in February 2020 was a key development for tech IPOs seeking index inclusion. Being part of a reputable index can provide better exposure to institutional investors (see ‘Index Inclusion’ - item five on this list).
2. Growth in foreign listings
ASX has more than 260 foreign listings.[xvii] New Zealand comprises just under a quarter of international listings, followed by United States companies. Israel, Singapore, Malaysia, and Canada have been other sources of IPOs on ASX this century.
New Zealand companies listed on ASX include The a2 Milk Company (A2M), Auckland International Airport (AIA), Air New Zealand (AIZ), Fisher & Paykel Healthcare Corporation (FPH), Kathmandu Holdings (KMD), Laybuy Group Holdings (LBY), Pushpay Holdings (PPH), Spark New Zealand (SPK), and Xero (XRO).
Privatisation of NZ energy assets in the previous decade was a new source of dual listings on ASX. The IPO of Mighty River Power in 2013 (now Mercury Energy) (MCY) was followed by Meridian Energy (MEZ)(2013). Contact Energy (CEN) listed on ASX in 2015. These IPOs increased the representation of NZ companies on ASX and added to this market’s exposure to renewable-energy assets.
In September 2015, ASX introduced a new category of dual listings: “NZ Foreign Exempt”. This made it easier and cheaper for NZ companies listed on NZX’s main board to dual list here.
NZ companies chose to list on ASX (in a dual or sole listing) because Australia provides access to a much larger pool of investable capital compared to New Zealand. Some Australian fund managers have to invest in ASX-listed stocks to meet their investment mandate, meaning they can invest in NZ companies if they are dual-listed in this market.
US companies listed on ASX included Life360 (360), Avita Medical (AVH), ResMed Inc (RMD) (it was founded in Australia), Livetiles (LVT), Limeade (LME), and Sezzle Inc (SZL).
An ASX IPO has been attractive to US firms that are too small to stand out in their home exchange but are well suited to ASX and its strong base of small- and mid-cap companies.
3. Healthcare IPOs add new life
Growth in healthcare, pharmaceuticals, biotechnology, medical-device makers and lifescience companies is another feature of the IPO market on ASX. There have been more than 80 healthcare listings on ASX since 2013.
In June 2013, Virtus Health (VRT) became the world’s first invitro-fertilization company to list on an exchange through an IPO. In 2014, Monash IVF Group (MVF) listed on ASX. The two IVF IPOs raised a combined $650 million.
Healthcare IPOs were prominent in 2014. Healthscope (HSO) (raised $2.25 billion, and aged-care providers Estia Health (EHE), Regis Healthcare (REG), and Japara Healthcare (JHC) raised a combined $1.6 billion.
Recent IPO highlights (by capital raised) included Telix Pharmaceuticals (TLX), Oceania Healthcare (OCA), Visioneering Technologies Inc (VTI), Oneview Healthcare Plc (ONE), and AFT Pharmaceuticals (AFP).
Since 2019, larger healthcare IPOs on ASX include Doctor Care Anywhere Group Plc (DOC), CleanSpace Holdings (CSX), 4DMedical (4DX), Aroa Biosurgery (ARX), and Next Science (NXS).
ASX has done much work to facilitate growth in healthcare IPOs and support listed healthcare companies, in part drawing on its experience with early-stage mining company IPOs.
In May 2013, ASX and AusBiotech in a joint initiative issued a “Code of Best Practice” for Reporting by Life Science Companies, after extensive industry consultation. Although not mandatory, the Code helps ASX-listed lifescience companies meet their continuous disclosure obligations under ASX Listing Rules.
In early 2000, ASX extended quarterly cash-flow reporting to companies classified as Commitment Test Entities (CTE) to address governance issues associated with higher-risk entities. Many biotech companies now report quarterly activity statements.
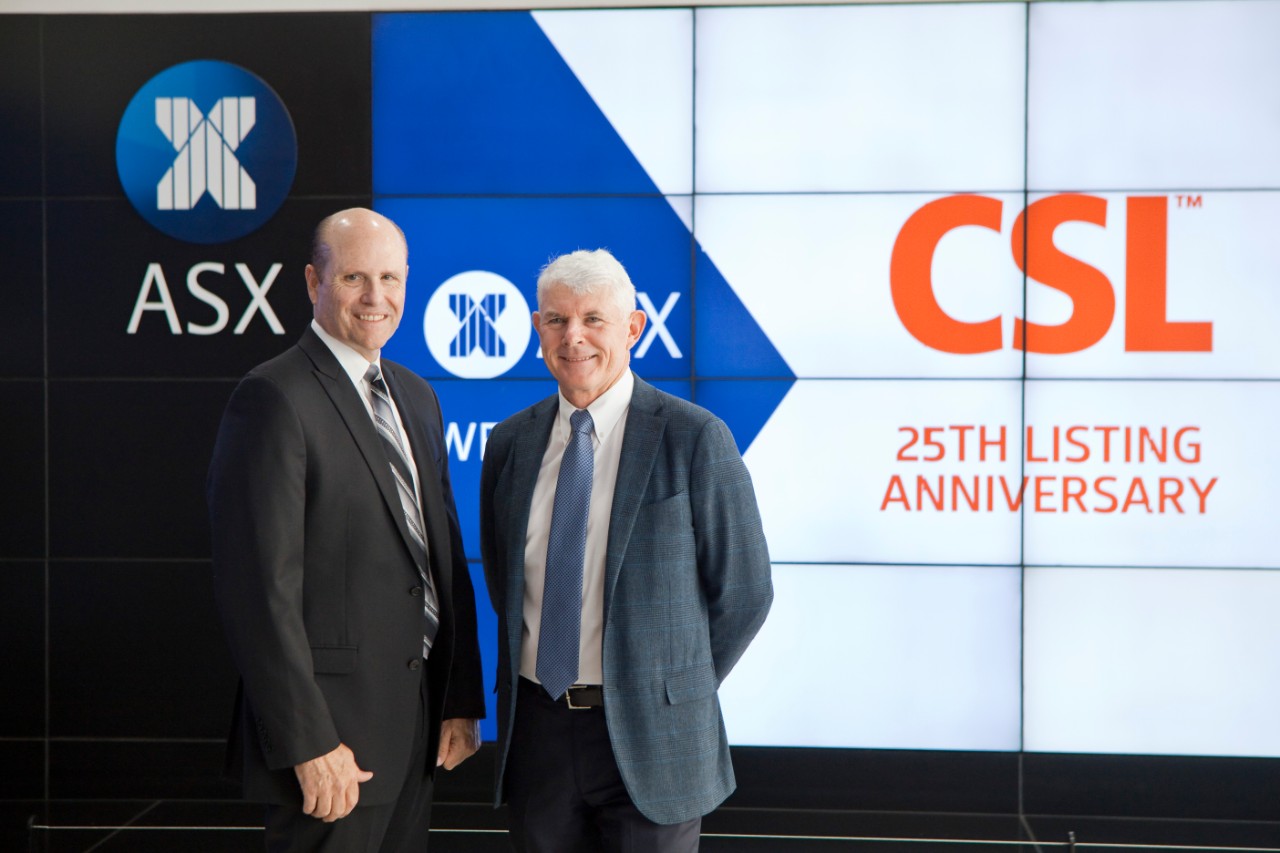
Growth in healthcare IPOs has increased the size of healthcare on the Australian sharemarket. The healthcare sector has a 10 per cent weighting in the S&P/ASX 200 index.[xix] Healthcare is now half the size of the materials sector[xx], in part due to the growth of sector-leader CSL (CSL).
In June 1994, CSL (CSL) listed on ASX through an IPO at $2.30 a share, through a privatisation by the Federal Government. In April 2021, CSL traded at $265.[xxi]
The increase in healthcare IPOs has given Australian investors more choice in a sector that potentially has good long-term growth prospects as populations age, and as new drugs, medical devices, and healthcare services and technologies are developed.
4. Resources IPOs shine
No essay on the ASX IPO market is complete without an analysis of mining and energy IPOs. Resource companies have long been a mainstay of the IPO market, by listings volume.
There have been more than 700 resource IPOs on ASX from 1998 to 2021. The first wave of resource IPOs began around 2004 as the mining-investment boom intensified. Several Australian miners with offshore projects raised capital via IPOs.
This gave the ASX materials sector more of an international focus compared to other exchanges. Africa, in particular, was a focus for Australian gold miners at the time. By contrast, mining companies listed on Toronto Stock Exchange were more focused on South and Central America.
Like most sectors, mining and energy lost favour after the 2008-09 Global Financial Crisis. Resource IPOs on ASX slowed. When mining started to recover before other sectors after the GFC, so, too, did resource IPOs on ASX. A second wave of resource listings began in 2011.
The resource sector tends to have much smaller IPOs, on average, than other sectors on ASX. Many mining and energy companies raise only $5-$10 million in their IPO. Often, they are seeking capital to develop early-stage projects in the exploration phase.
Some mining explorers discover minerals that can be feasibly extracted, and raise further capital on ASX through placements, rights issues, share purchase plans or accelerated issues to fund mine construction and production. ASX ranked first globally for the number of secondary capital raisings in 2020.[xxii]
By helping mining and energy companies raise capital, the IPO market on ASX has contributed to the long-term success of Australia’s resource sector. Many small exploration companies have grown into large mining producers over the years. Others have failed along the way.
The large volume of resource listings highlights another strength of the IPO market on ASX: a well-educated investor base that is willing to support emerging ventures.
Listing at an earlier stage on ASX – rather than seeking additional private funding – has supported many resource companies. This is also true of emerging biotech, fintech, cleantech and information technology companies that raised capital via an IPO rather than through additional rounds of venture-capital or private-equity funding.
In compliance, ASX Listing Rules have a longstanding requirement for mining and energy explorers to produce quarterly activity statements. This information helps investors understand if a company is meeting its business objectives, and assess its cash-flow position.
Information transparency and reliability in listed resource companies are also supported by reporting standards for mineral resource classification through the Australian Joint Ore Reserves Committee Code (JORC).
5. Index inclusion an IPO incentive
Launched in February 2020, the S&P/ASX All Technology Index (XTX) has 75[xxiii] constituents from the information technology and other sectors on ASX. The index rose 84 per cent over one year to end-March 2021.[xxiv]
Index inclusion is an attraction for companies that list on ASX through an IPO. Early entry into a globally recognised index, such as the S&P/ASX 300 index, can attract institutional capital to a company sooner. Index inclusion can also increase liquidity in the company’s shares when a larger group of institutional investors buy or sell.
Fund managers, for example, might build a position in companies in their benchmark index (against which their fund’s performance is compared).
An Exchange Traded Fund (ETF) issuer will replicate the weighting of shares in an underlying index to mirror its performance. ETF issuer Betashares, for example, has an ETF over the S&P/ASX All Technology Index (the BetaShares S&P/ASX All Technology ETF).
A technology company with a minimum market capitalisation of $120 million will gain entry to the S&P All Technology index.[xxv] The S&P/ASX 300 index requires a minimum market capitalisation of $446 million and the S&P/ASX 200 index requires $1.6 billion.[xxvi]
By contrast, a company needs a minimum size of $7 billion to be included in the FTSE 100 index in the United Kingdom. Or $21.8 billion for inclusion in the S&P 500 index and $31.1 billion for inclusion in the NASDAQ 100 index in the United States.[xxvii]
The result is small- and mid-cap listings in Australia have greater opportunity for index inclusion compared to larger offshore exchanges.
6. Compliance/governance adds to confidence
Unlike other exchanges, ASX has long resisted calls this century to establish a “second board” that has less-stringent rules and requirements for smaller listed companies.
That means a $5-million listed entity on ASX is subject to the same ASX Listing Rules and ASX Corporate Governance Principles and Recommendations as a $5-billion company (there is flexibility with governance recommendations, under the ‘if not, why not’ principle).
ASX has also resisted the international trend of stock exchanges allowing dual-class shares. Such shares provide owners of certain share classes with superior voting rights. They can give company founders voting control that might be disproportionate to their ownership.
Dual-class shares have become popular in large tech IPOs overseas. Some founders favour dual-class shares because they give them more control of the company. In some respects, dual-class shares enable founders to run a listed company like a privately owned company. But if the founder underperforms, other shareholders have less power to change things.
Another important requirement in ASX Listing Rules relates to restricted securities that are subject to ASX escrow requirements. For earlier stage companies, these rules require various types of recipients, related parties, promoters or associates who held shares in the company before its IPO to retain those shares for a minimum period (usually 24 months) after quotation on ASX.
Escrow requirements are designed to stop early investors in a company selling their shares in an IPO upon listing. These rules help ensure the interests of seed investors in a company are better aligned with those of new shareholders who invest through an IPO.
These and other ASX initiatives provide more transparency and confidence for investors in new listings. That does not guarantee IPO success, but it does mean all ASX-listed entities must continually meet high compliance, reporting and governance standards.
7. Supporting great Australian companies
ASX has increased its support for new listings over the past decade. There has been more focus on attracting technology, fintech and biotech IPOs on ASX, as well as foreign listings.
Before COVID-19, the ASX Listings team attended events in the US, Europe and Asia, and met with offshore companies and institutional investors. Their work raised awareness of the benefits of an ASX listing and contributed to a new wave of tech listings.
In 2012, ASX introduced the ASX Equity Research Scheme to support the production of high-quality research for undercovered small-cap companies. The scheme has become one of the most successful exchange-driven research initiatives for small listed companies in the world.
About three quarters of all listed entities on ASX have a market capitalisation below $500 million.[xxviii] As a result, many small-cap companies are not researched by broking firms.
The ASX Equity Research Scheme subsidises equity research on eligible companies by partnering with a number of well-established research brokers working in the small- and mid-cap space. This research can drive liquidity and awareness of smaller stocks.
The Scheme covers approximately 100 listed companies each financial year that meet specific eligibility criteria, including a market capitalisation between $30 million and $1 billion and sitting outside the S&P/ASX 300 index.
ASX Evolve further supports investor-relations activities for listed companies. This program includes the semi-annual ASX Small and Mid-cap Conference; the ASX CEO Connect program, which showcases large-cap companies to Self-Managed Superannuation Funds and retail investors; and Listed@ASX, a bi-annual printed magazine that launched in late 2014.
The quarterly ASX On The Board newsletter is another ASX initiative for stakeholders in Australia’s IPO market.
About the author
Sources and notes
[i] ASX Investor Study. 6.6 million adult Australians owned shares directly in 2020. In 2000, this was 5.7 million.
[ii] Telstra’s three main stages of privatisation (T1, T2 and T3) ran from 1996 to 2006.
[iii] Xero initially dual listed on ASX through a compliance listing in 2012.
[iv] Based on ASX listings data from October 1998 to March 2021.
[v] Based on ASX listings data from October 1998 to March 2021.
[vi] ASX demutualised on October 13, 1998. It listed on ASX on October 14, 1998.
[vii] Then known as Australian Stock Exchange
[viii] Annual average of new listings on ASX from 2014 to 2020.
[ix] Annual average of IPO capital raised from 2014 to 2020.
[x] Average annual follow-up capital raised from 2014 to 2020.
[xi] Source: Willis Towers Watson Global Pension Assets Study 2020.
[xii] Source: Deloitte and APRA, November 2019. 2019 ^ Projected to 31 December 2038.
[xiii] The ASX Corporate Governance Principles and Recommendations (4th Edition February 2019). Under the Principles and Recommendations, if the board of a listed entity considers that a Council recommendation is not appropriate to its particular circumstances, it is entitled to not adopt it. If it does so, however, it must explain why it has not adopted the recommendation – the “if not, why not” approach.
[xiv] Source: Dealogic. Data at June 30, 2020.
[xv] In 2019. Source: Bloomberg.
[xvi] At 30 June 2020.
[xvii] At April 2020.
[xviii] ASX. Based on IPOs classified in healthcare sector from October 1998 to March 2021. Based on value raised.
[xix] S&P Dow Jones Indices, “Fact Sheet: S&P/ASX 200 Index.” At March 31, 2021.
[xx] S&P Dow Jones Indices, “Fact Sheet: S&P/ASX 200 Index.” At March 31, 2021. Materials had a 19.9% weighting.
[xxi] Closing price April 21, 2021.
[xxii] Source: Dealogic, 1 January to 31 December 2020; Includes placements, SPPs, rights issues. Excludes block trades, convertibles, DRPs, employee share schemes.
[xxiii] At March 2021 rebalance of Index.
[xxiv] Source: BetaShares.
[xxv] Market cap levels at which companies enter and exit indices vary from time to time depending on overall market cap and liquidity levels. These numbers are indicative based on recent historical rebalances.
[xxvi] Indicative values based on eligibility criteria or inclusions at last rebalance. “Company size” is total market cap. Exchange rates at 16 July 2020.
[xxvii] Indicative values based on eligibility criteria or inclusions at last rebalance. “Company size” is total market cap. Exchange rates at 16 July 2020.
The views, opinions or recommendations of the author in this article are solely those of the author and do not in any way reflect the views, opinions, recommendations, of ASX Limited ABN 98 008 624 691 and its related bodies corporate (“ASX”). ASX makes no representation or warranty with respect to the accuracy, completeness or currency of the content. The content is for educational purposes only and does not constitute financial advice. Independent advice should be obtained from an Australian financial services licensee before making investment decisions. To the extent permitted by law, ASX excludes all liability for any loss or damage arising in any way including by way of negligence.
