Learn more
Interest rate futures - 2020 wrap
2020 was a challenging year for interest rate markets globally with FIA recently reporting a decline in global turnover and Open Interest of 13% and 19% respectively when compared to 2019. Australia was no exception with turnover and Open Interest down 16% and 17% when compared to 2019. The introduction of un-precented RBA monetary policy measures designed to effectively reduce the cost of borrowing by lowering the official Cash Rate and to target the 3 year bond yield, had the combined effect of compressing interest rates (particularly at the front end of the curve), market volatility and turnover. In contrast, increased issuance from the AOFM, particularly in the 10-12 year part of the curve, drove record levels of Open Interest and turnover in the 10 Year Bond Future.
The 30 Day Interbank Cash Rate Futures and 90 Day Bank Bill Futures were the most affected by the low rate, low volatility environment with turnover down 56% and 51% respectively when compared to 2019. While the 3 year contract continues to remain an important hedging tool, the effect of Yield Curve Control can be seen in lower levels of Open Interest and turnover when compared to 2019, down 24% and 18% respectively. The 10 Year Bond Future was the exception with turnover and Open Interest both up 13% when compared to 2019, largely driven by increased issuance from the AOFM and relatively higher levels of volatility at the longer end of the curve.
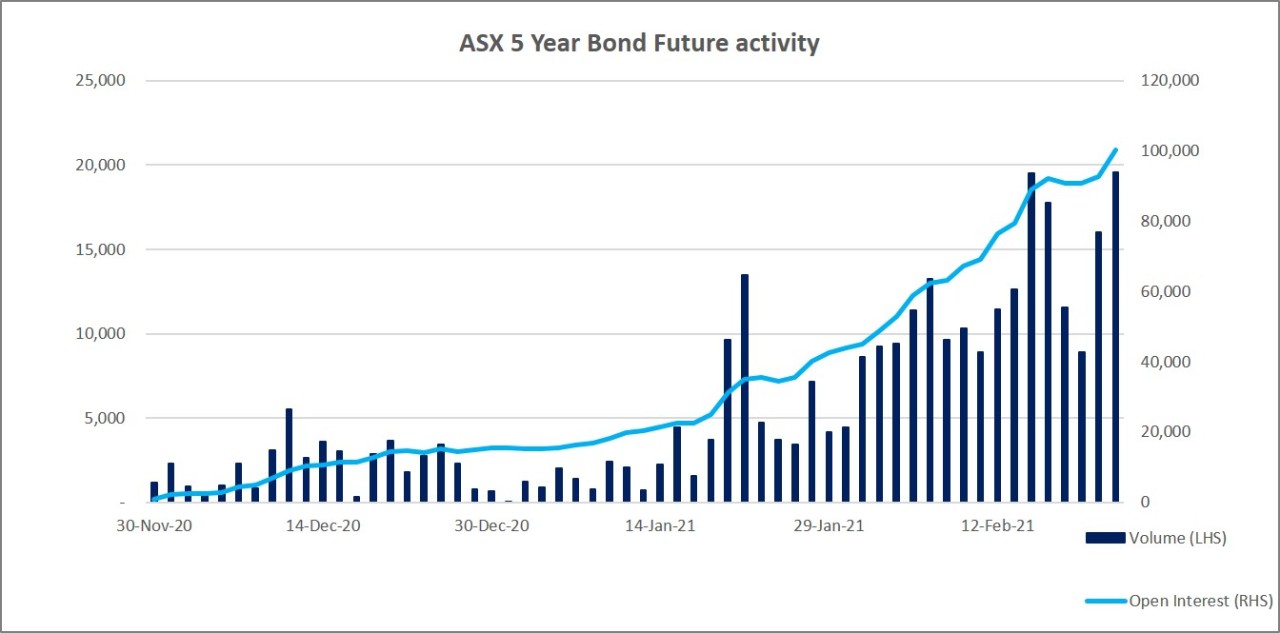
The 5 Year Bond Future was launched at the end of 2020 to bridge the gap between the 3 and 10 Year Bond Futures. By the end of 2020, there were approximately $270 billion in physical Treasury bonds sitting between the lines that underpin the 3 and 10 year contracts. The 5 Year Bond Future provides an additional liquidity point and hedging tool at the mid part of the curve that allows market participants to manage their risk exposure in a more efficient and effective manner.
Q4 2020
The Q4 2020 rates futures volumes were largely in line with Q3 2020, reaching 31 million contracts vs 31.8 million in Q3. Activity at the front end of the curve picked up in Q4 with the 30 Day Interbank Cash Rate Futures and 90 Day Bank Bill Futures up 78% and 4% respectively vs Q3, largely driven by expectations of an RBA rate cut in November.
Turnover in the 3 Year Bond Future was down 10% while Open Interest at the end of Q4 was down 30% when compared to the end of Q3. Activity in the 10 Year Bond Future was largely in line with Q3 with turnover up 1% while Open Interest remained strong at 1.4 million contracts (down 8% when compared to the end of Q3).
Open Interest in the 20 Year Bond Future increased by 23% to 17,500 in Q4 driven by the increase in government issuance.
The December roll represented the second roll with reduced tick increments for the 3 and 10 Year Bond Futures. Similar to the September roll, the market was orderly and well spread throughout the 5 day period. The changing Open Interest dynamic between the 3 and 10 Year Bond Futures was reflected in the 3 and 10 Year roll volume.
- 3 year roll activity was down 10% vs September, largely driven by the decline in Open Interest which was 24% lower than September. This was offset by 10 year roll activity which was up 6% vs September and 13% vs June (pre tick change).
- 10 year activity was driven by elevated levels of Open Interest on the back of increased AOFM issuance and relative levels of volatility at the long end of the curve.
- Activity was more evenly distributed across the roll period with Participants commencing their roll activity early.
- Bid/offer spreads remained at the finest tick increment throughout the period.
- 3 year depth on the bid side was somewhat reduced when compared to September and June but was in line with levels seen in 2019, while 10 year depth on the bid side was commensurate with prior rolls. Order book depth on the offer side was noticeably lower across both contracts.
ASX will continue to monitor the effects of reduced tick size throughout the March 21 roll.
A total of 86,460 90 Day Bank Bill Futures contracts were taken to cash settlement, an increase of 20% vs September.
OTC
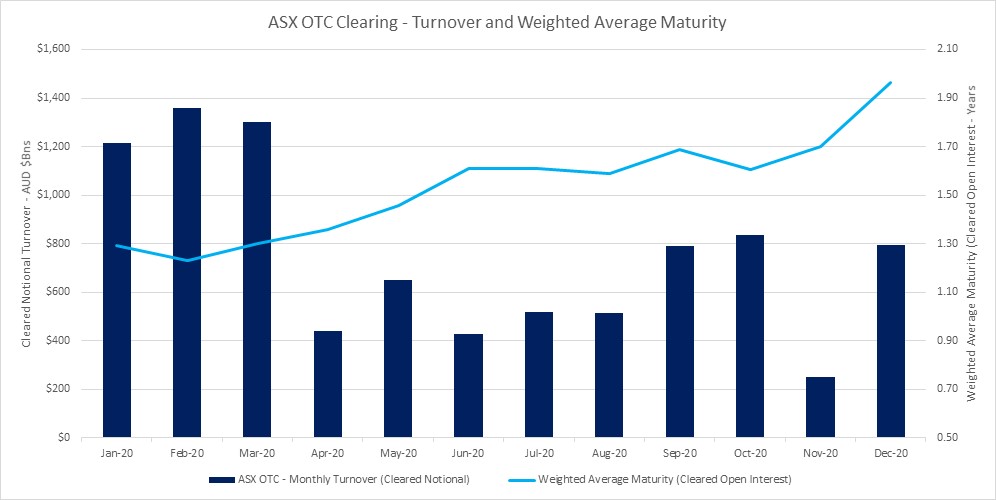
Global AUD OTC swap volumes continue to be lower driven by a significant decrease in shorter-date interest rate swap and OIS volumes as a result of the low rate environment and yield curve control. ASX’s OTC Clearing service continues to perform well in this environment, with total notional cleared of A$1.88 trillion in Q4 2020, up 3% vs Q3 2020.
ASX has grown its activity and market share in longer dated interest rate swaps, with Weighted Average Maturity of ASX Cleared Interest Rate Swaps growing 52% to 1.95 years during calendar year 2020 with market participants taking advantage of ASX’s lower total cost of clearing and the available cross-margining offsets (average 40% cross-margining benefit across users of ASX’s Margin Optimisation service).
NZD OTC Clearing activity has continued to grow during Q4 2020 with NZ$32bn notional value cleared across NZ Interest Rate Swaps and NZ Overnight Index Swaps. ASX continues to be a highly capital and cost efficient venue for AUD and NZD interest rate derivatives via its ability to offer both cross-product (futures vs OTC swaps) and cross-currency (AUD vs NZD) margin offsets across its Rates product suite.

